This article on MACD settings for Swing Trading is the opinion of Optimus Futures, LLC and not intended to be trading advice.
Swing trading is a type of trading that targets the short-term to medium-term trend in any financial instrument. The trade generally lasts over a period of a few days to a few weeks.
While swing trading can expose you to overnight and weekend risk, it also might allow you to catch bigger trend movements and, potentially, larger returns.
In another article, we introduced the MACD and provided examples of how a longer-term trader can use it to catch larger trends.
How can we use this tool to capture swing trading opportunities or short-term trends lasting a few days to a few weeks?
Here are a few example strategies to consider.
MACD for Swing Trading | Indicator Settings
Generally, a trader looking to implement this method would:
- Identify the chart patterns/trendlines in the higher time frame.
- Monitor price action at key inflection points, such as areas of support, resistance, or where trendlines converge on a lower time frame.
- Initiate buy or sell signals provided by the MACD, crossing the signal line in sync with the higher time frame trend.
- Place stops above the resistance area or below the support area.
- Exit the trade when the opposite signal occurs.
Disclaimer: The placement of contingent orders, such as a “stop-loss” or “stop-limit” order, will not necessarily limit your losses to the intended amounts since market conditions may make it impossible to execute such orders.
In figure 1.1, the downward and upward sloping trend lines are drawn on the weekly chart of the YM.
To draw a trend line, a minimum of two points are required, and then watch the price action closely as it approaches again to the trendline support or resistance levels.
Figure 1.1. YM Daily Chart from March 2022 to August 2022 – Source: Optimus Flow
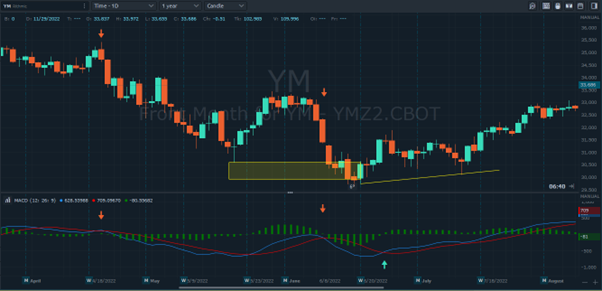
In Figure 1.2, observe the highlighted areas on the daily chart and the MACD. On April 20, 2022, the MACD gave a sell signal.
The short entry was exited on May 23 based on the MACD positive crossover.
On June 9, the MACD was again giving a sell signal, but it was precarious, as it would mean shorting the stock near support levels.
The MACD crossover on the 26 provided confirmation that an upward reversal (near support) was likely to occur.
Figure 1.2 YM Daily Chart – Source: Optimus Flow
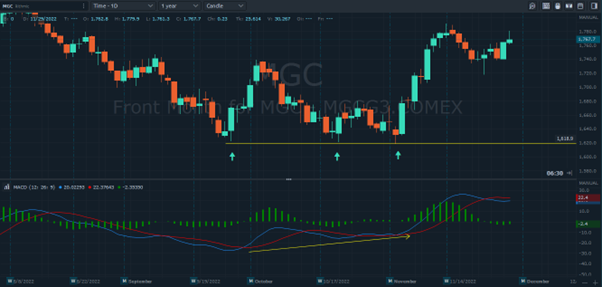
A similar kind of trade setup can be observed in figure 1.3
Figure 1.3 Micro Gold (MGC) Daily Chart August 7 to November 29, 2022
Note the divergence between a flat MGC price bouncing off support and a rising MACD line. This indicated the likelihood of an upward price reversal which eventually materialized following the third bounce.
Another approach you might consider is using an indicator that measures money flow into a given asset.
In this case, the Money Flow Index is a predictive indicator that can anticipate changes in trend movement.
MACD + Money Flow Index(MFI)
In this strategy, we will combine the crossover of MACD with the overbought/oversold signals produced by the Money Flow Index (MFI).
The rules in this approach are pretty simple:
- When MFI is rising above oversold levels, and the MACD line crosses the signal line from below simultaneously, consider it a potential buy signal.
- When MFI is above or near the overbought level, and the MACD line crosses the signal line from above simultaneously, consider it a potential sell signal.
- Exit the trade when MACD gives an opposite signal.
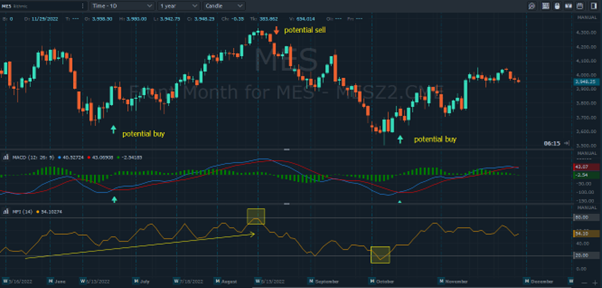
Figure 1.4 Micro E-Mini S&P 500 Index Futures Daily May 15 to November 29, 2022 – Source: Optimus Flow
The chart demonstrates the rules stated above in combining the MACD with the MFI. When the MFI is above its oversold level and rising (see arrow), a buy signal is generated when the MACD exhibits a positive crossover.
A sell signal is generated when the MFI touches the overbought level and the MACD crosses below its signal line.
The Bottom Line
The MACD is a flexible indicator; one that can easily be combined with others to generate trading signals. If you gain anything from the examples above, it’s the idea that you can construct your own approach using this tool.
The examples / MACD settings for swing trading above are not to be taken as surefire recommendations. These were examples, and you are more than welcome to experiment with your own setups combining MACD as a trade reference.
Hopefully, they will inspire you to explore the MACD further in order to construct your own unique strategies.
Remember to always test your strategies before putting them to use.
Gaining an “edge” in the markets can sometimes mean doing something that other traders are not doing. This requires lots of creativity, hard work, testing, tweaking, and starting over from scratch.
But once you can develop your own unique way to gain returns from the market, your performance could potentially be well worth all the time and effort you put into it.
They are simply basic examples of how the MACD can be used with other technical indicators to one’s advantage.
A trader should always test the strategy himself before putting it to use.
There is a substantial risk of loss in futures trading. Past performance is not indicative of future results. Charting presentations and scenarios are presented as examples only and were prepared with the benefit of hindsight.

