Trend lines are among the most commonly used trading tools used by technical futures traders. Whether you run a trading strategy built entirely upon using and trading off of trend lines, or you use them in a limited capacity to determine your entries (or exits), the need to locate the high-quality ones that aid in trade placement or management is a critical skill for a technical trader to master.
The hunt for quality when it comes to trend lines stems from the fact that they can be drawn to connect essentially any two lows or highs on a chart, but may not always be as useful. Let’s look at three ways you can separate a potentially high-quality trend lines drawn on a chart, versus any random trend line connecting multiple highs or lows.
1) Trend Lines Precision
Precision is a key factor when it comes to the strength of a trend line. The markets are not efficient enough to be yielding perfect price action all the time. After all, what you see printed on your charts as price data is really just the result of trading orders being filled at a particular price. We would all love the market continuing to repeat history precisely, but that is not mostly the case.
While the market will usually respect prior swing points and areas of interest, the likelihood of the exact order flow action repeating at these points is rare. And that is precisely why a trend line that hosts precise touches can be such a valuable piece of market information.
Simply put, a trend line that price responds to accurately is a much stronger one to use for your trading decisions than a trend line that stacks lose order flow all around it.
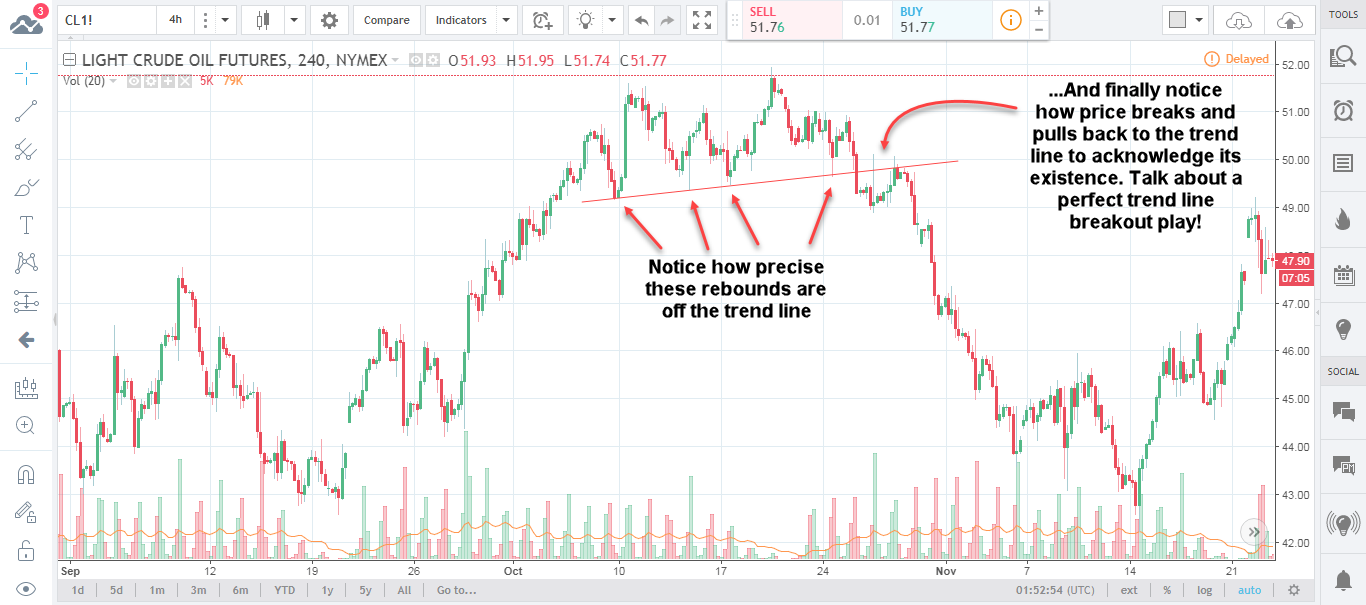
Let’s take a look at a chart for a visual explanation:

2) Trend Lines Touch Frequency
Another factor you must consider when determining the quality of your trend line is the frequency of touches, or simply put, the number of times price has respected the trend line. We obviously need two touches to create a trend line in the first place, but are two touches enough to validate a trend line? Technically yes, but let’s explore this a bit more.
We discussed above that a trend line can essentially be drawn connecting any two highs or lows. Going by that definition a trend line that hosts just two touches is of course valid. But given how you could draw such lines endlessly on your chart till you barely see your candles, we need to be more selective with using two-touch trend lines.
An acceptable way of doing that is to only use two-touch trend lines when the swing points you are using are deep and authoritative – i.e using only the turning points that resulted in large moves and ignoring the minor swing points.
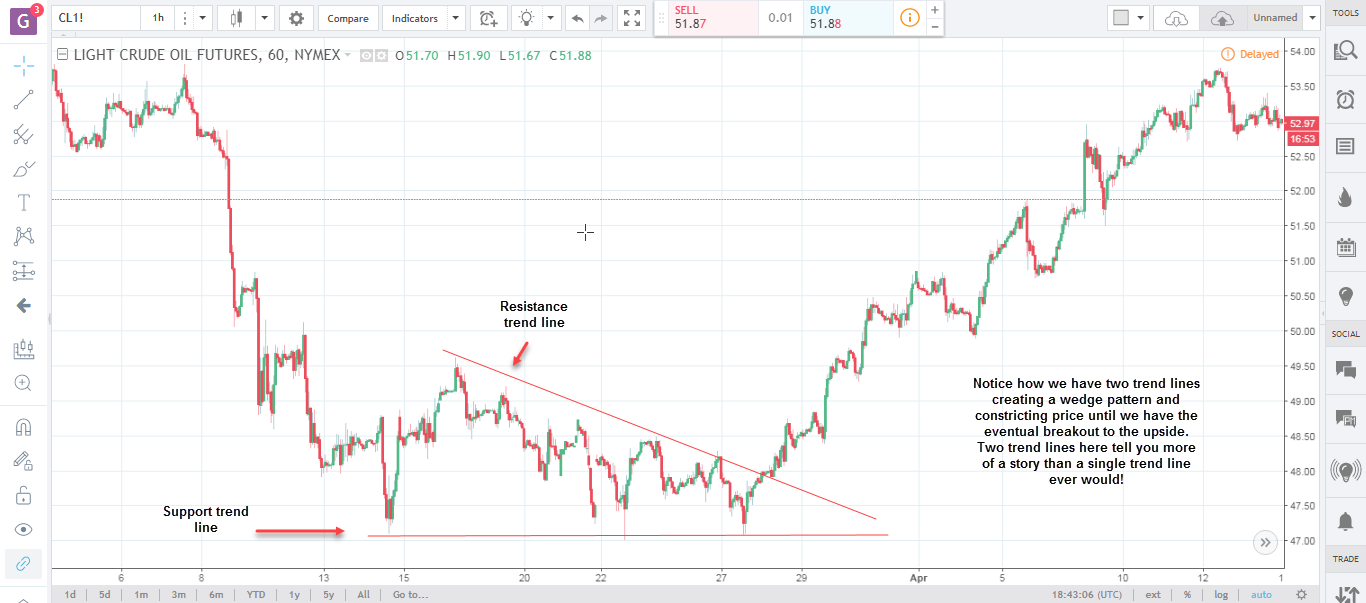
Here’s a chart for reference:

Generally speaking, the number of (preferably precise) touches you see on a trend line, the more proven and reliable the trend line is. However, instead of taking a touch for literally just being that, it also helps tremendously to notice the rhythm of the touches. Generally speaking, the number of (preferably precise) touches you see on a trend line, the more proven and reliable the trend line is. However, instead of taking a touch for literally just being that, it also helps tremendously to notice the rhythm of the touches.
A nice consistent rhythm with the frequency and strength of the touch is what you are looking for in a high-quality trend line. Beware of sudden inconsistencies in either the frequency or the strength of the touches!
At this point, refer to the first chart posted in this article. Notice how the first four touches on the trend line are precise, while the two touches after that are not as precise and perhaps a warning sign of an impending break.
Similarly, if the price is reverting back to the trend line too frequently, again it could potentially be a sign of trend line weakness, rather than strength. Think of a strong trend line as one that a lot of traders are watching. Ideally, as soon as price hits the trend line these traders would be quick to jump in the market resulting in a sharp and sustained move in the opposite direction.
What then, can you conclude about a market that keeps coming back to the trend line fairly often? It would depict that the order flow around the trend line just isn’t strong anymore. Such a trend line is likely weak and possibly worth a breakout play at some point.
3) The Bigger Story
We have talked so far about the highs and lows that connect to create trend lines. Let’s talk about connecting trend lines and combining them with other factors that create an even more useful way of using them as part of your trading strategy.
Trend lines are often very reliable when they form a chart pattern or when they fall in confluence with other frequently used technical indicators like moving averages as well as key support and resistance levels and round numbers.
The art of skillful trading is all about trying to stack as many odds in your favor as you possibly can to locate the highest probability trade setups. That requires having to look at the bigger picture, often well beyond just a single trend line and the price action around it.

Trend lines, when used correctly, can be one of the most reliable forms of technical indicators out there. Whether your strategy calls for trading trend line breakout or rebounds, locating the right ones at the right spots are vital to your success as a technical Futures trader.
ALSO READ | Do Trend Following Strategies Work When Day Trading Futures?
There is a substantial risk of loss in futures trading. Past performance is not indicative of future results.