This article on Candlestick Patterns is the opinion of Optimus Futures.

The basics of price action dynamics for the most part boil down to chart and candlestick patterns and their precise appearance and locations, making them high probability trade entry targets.
However, as you evolve as a trader and develop a deeper understanding of price action and order flow dynamics, it may be worthwhile to explore the world of price action beyond just the basics of candlestick patterns and chart patterns. Namely, going back into the actual information that most of these setups dispel and how the same information can be used in your analysis without having to rely on the printing of an obvious looking pin bar to enter a trade.
Let’s go over two concrete examples of how familiar information can be used in different contexts to yield valuable price action understanding and upgraded chart analysis.
The Inverted Pin Bar
If you have spent any amount of time studying candlestick patterns, you would have likely come across the pin bar candlestick pattern – often referred to as the hammer pattern. It is one of the mostly commonly traded candlestick patterns and highly sought after by technical traders.
The heading of this section however reads “inverted pin bar” – a term you may not be entirely familiar with. Let’s start by decoding the actual information that a conventional pin bar dispels:
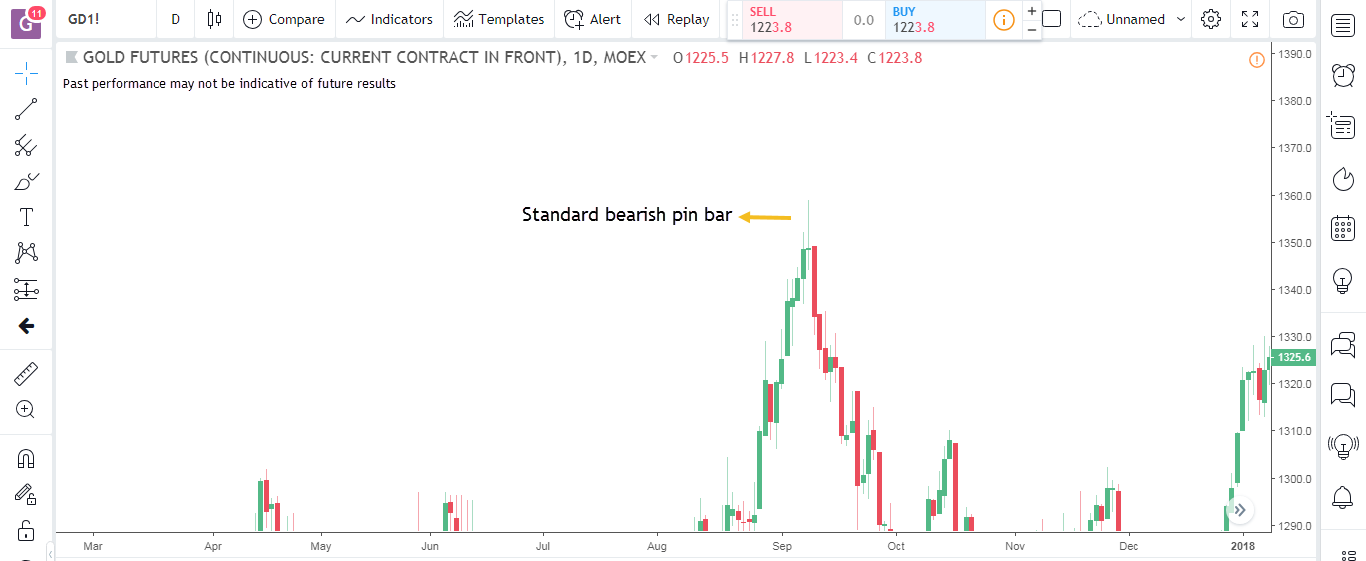
The chart above shows a conventional bearish pin bar on the Gold futures market. The wick on the upside of the candlestick shows that while price was bid higher during the time period, it was countered strongly by sellers and so eventually price closed near the open by the end of the period. So essentially we have a period where both buying (coming off of the current trend to the left of the pin bar) and selling came in to the market.
If you notice, while the pin bar itself is an actual candlestick pattern that traders often objectively look out for and pursue, the information that a pin bar dispels is actually a fairly common market phenomena: Price pushing towards a major area of support or resistance and then the opposite party jumping into the market to reverse that move.
As long as you understand the dynamics of support and resistance and when it is important to emphasize sellers entering a bull market and buyers entering a bear market, you may be all set to start exploring your charts beyond conventional candlestick and chart patterns.
Let’s look at an inverted pin bar:
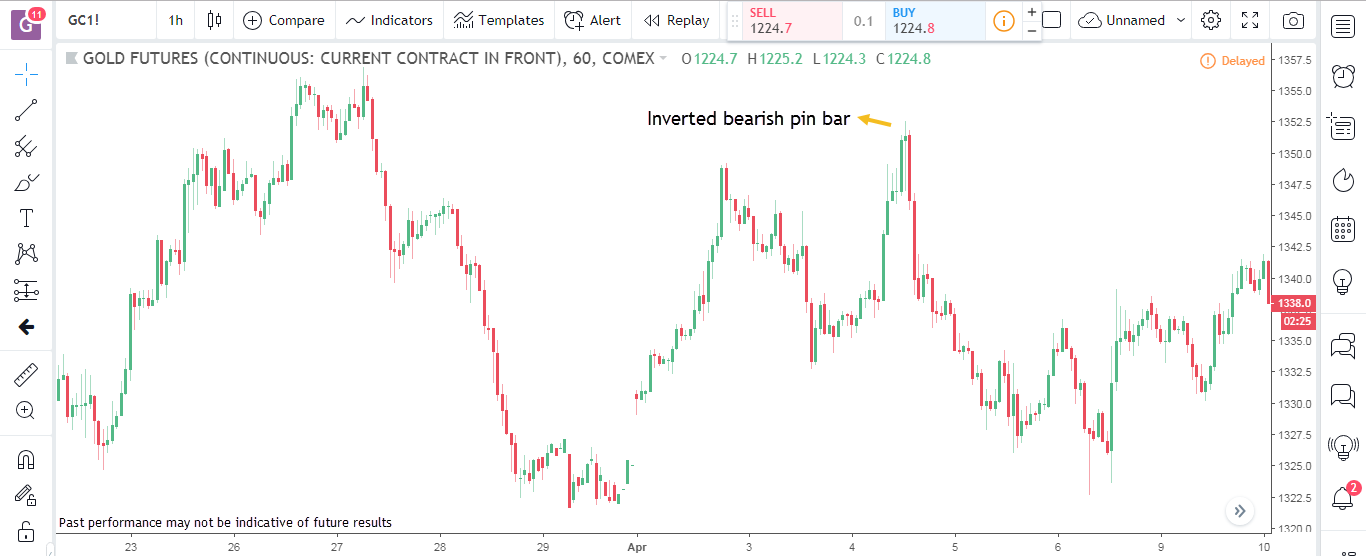
We are typically looking for bullish pin bars at swing lows where a wick sticking out at the bottom gives us a clear indication that buyers seem to be entering a bear market, making a potential entry trigger for a long trade. Does the same pin bar at a swing high convey the same information? Well actually it may be dispelling information that is quite the opposite, and somewhat more in line with the information provided by a bearish pin bar at the same location.
Notice, that even though we have a wick to the downside on the above mentioned pin bar as opposed to having a wick on the top as you would typically expect of a conventional bearish pin bar at a swing high, the information conveyed is more or less similar: sellers making an impact in a bull market.
The real difference in the appearance of a regular pin bar and an inverted pin bar comes from the timing of the activities from both the sellers and the buyers within the time period. In the case of the inverted pin bar above, we had selling come in first during the period, followed by bullish activity later on which leaves a wick to the downside. If this were a conventional bearish pin bar, we would likely have had the same tug-of-war between the buyers and the sellers, except that buying would have preceded selling during the time period, which would have left a wick to the upside on the candlestick. Either ways, you will note that we have roughly the same information being displayed by the pin bar – regular or inverted – at a swing high or low.
Combining Candlestick Patterns
Another novel approach to study price action involves combining trading periods – or visually speaking – combining candlesticks to complete viable analysis of a potential trading opportunity or general price action.
Since we are talking about pin bars, we will stick with this popular candlestick pattern to demonstrate the point.
We discussed above that a pin bar is formed when sellers enter a bull market and buyers enter a bear market within the same trading period. We also discussed how buying preceding selling or vice versa may actually flip the pin bar around for a more unconventional yet entirely similar viewpoint of market sentiment at that point in time.
However, if we are really looking for strong selling in a bull market that is fast approaching a resistance area – thereby potentially printing a pin bar – can we try eliminating time period denominations too and look at the market as a continuous moving force which is what it realistically is anyway?
Some traders will often avoid trading a pin bar merely for its meager looks due to unfavorable trading activity in the last few minutes of the trading period that closes off the candlestick itself. Is that entirely necessary when you understand the role of fresh buying or selling coming in at an obvious support or resistance area and know that price action on the chart is deliberately being chopped up into customizable time slots (or in some cases tick)?
Let’s try to observe the bulk of the information that a pin bar typically contains – as part of continuous trading activity or multiple candlesticks:

The chart above shows the market printing a 2-candlestick bearish pin bar. We are looking at the daily chart for the Euro currency futures from mid-October. Essentially the marked pattern is a 2-day bearish pin bar. You will note the characteristic information that a bearish pin bar exhibits is displayed clearly on the two candlesticks poking through major resistance as outlined on the chart – except of course we do not have a conventional bearish pin bar that would have printed bullish and bearish activity on the same day. Instead we have the bullish and bearish activity spread out across two trading periods. As you can see it makes little difference for a continuous market, and possibly for a trader who is very well aware of what he or she is looking for.
Beware of Over-Extending Your Analysis
The big problem with extending your analysis to include unconventional means like making up your own candlestick patterns or combining trading periods, is that they can very easily be overdone to the point where you could potentially start seeing far too many potential interesting situations that can easily lead an inexperienced trader towards lower profitability and possibly over trading.
The idea behind having to look beyond candlestick patterns is to understand their actual dynamics and where they gain their fame and popularity from, and simply applying the foundational information that these patterns provide in a broader, more useful sense. We urge our readers to extensively test all ideas and strategies before applying them in real-time trading. The above mentioned techniques do not represent any proven trading methods but reflect mere analysis tools to deepen your understanding of the technical aspects of financial markets and promote creative and thoughtful mental processes for potentially improved trading results.
There is a substantial risk of loss in futures trading. Past performance is not indicative of future results.