This article on Volume Profile Trading is the opinion of Optimus Futures.
Key Points:
- Volume profiles are powerful analytics that display where the most and least volume occurs in a given period, identifying a value range as well as a point of control where the highest volume occurs.
- While market profiles look at the time spent at each price, volume profiles look at the number of contracts or shares traded.
- Traders use these profiles to identify areas of support and resistance, as well as spots unlikely to contain either.
- Common volume profile shapes include P-shape, D-shape, b-shape, and B-shape.
Are you looking for a quick overview of Volume Profile in action? Watch this video for a summary of this article
Traders analyze this relationship to develop strategies and ideas about the market.
This has led to several indicators including volume-weighted average price (VWAP), moving averages, and the like.
Volume profiles take these two concepts deeper, letting traders see how much or little action takes place at different prices.
We had previously discussed volume analysis in the context of footprint charts.
Today, we want to add another layer by digging into volume profiles, explaining what they are, how to read them, interpreting different shapes, and offering up a few strategies to get you started.
What Is A Volume Profile
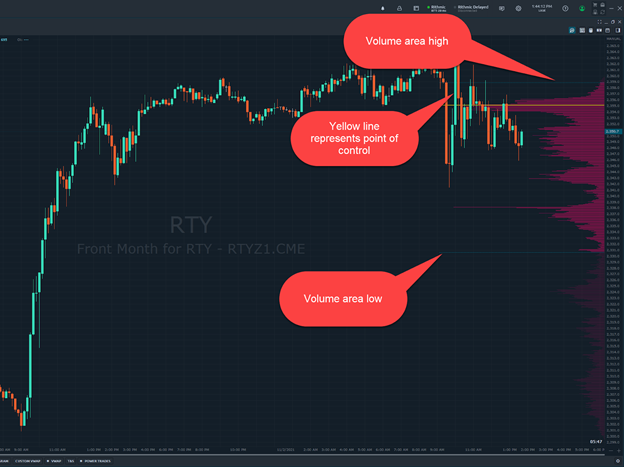
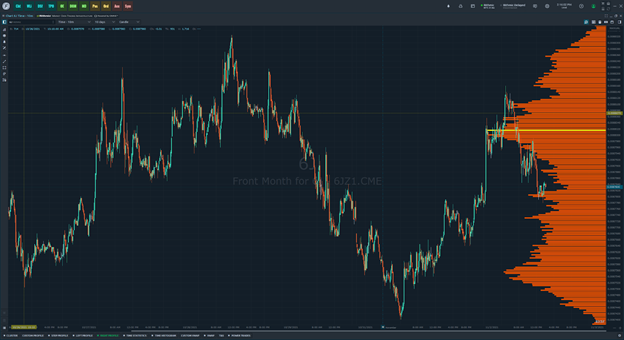
Volume Profile displays trading activity over a specific period at certain price levels. Displayed as a horizontal histogram (see sample below), it shows significant price levels based on trading volume.
Due to its orientation, the Volume Profile can also be referred to as Horizontal Volume.
Understanding the price action in the context of volume adds another level of analysis that helps traders make better decisions.
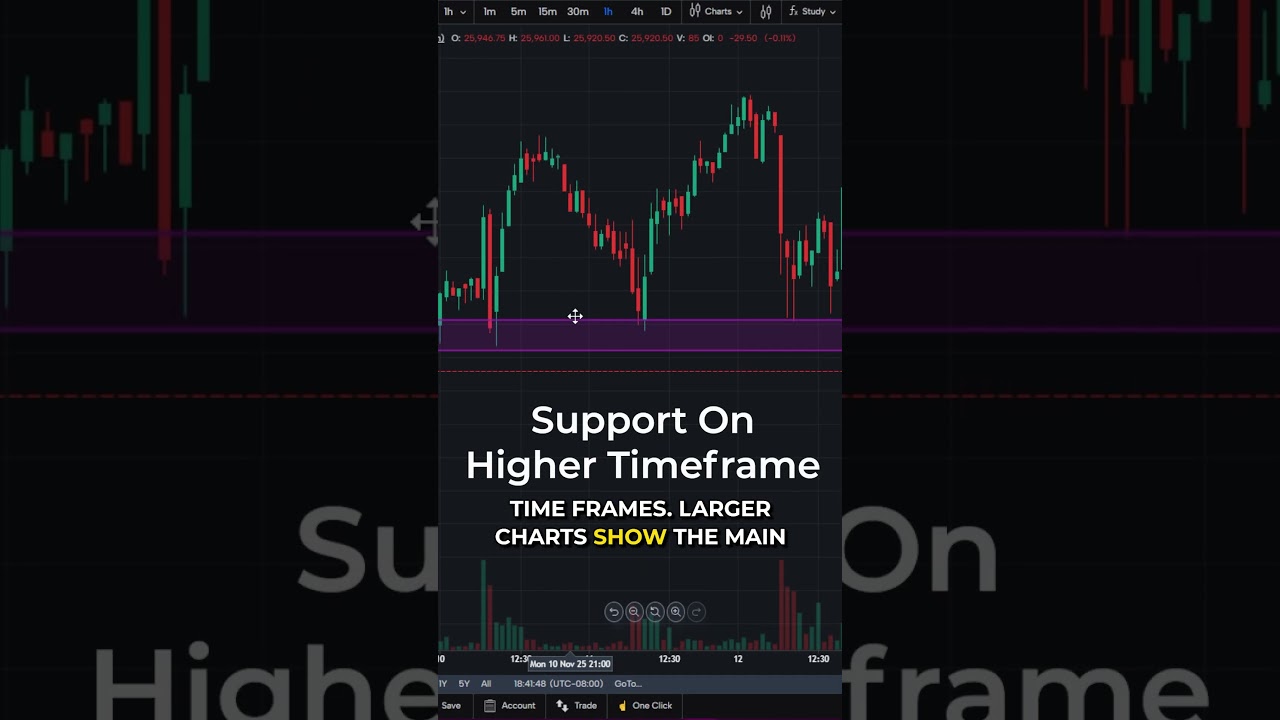
Volume profiles help traders identify key points within a given time period that can act as support and resistance.
These include:
- Point of control – A price level where the highest traded volume occurred, often represented with a yellow line.
- Profile low – The lowest price traded during the period
- Profile high – The highest price traded during the period
- Value area – A range within the profile where most of the volume occurred. Typically, traders will use 70% as the benchmark. The range is bordered by the value area high and low.
Is Volume Profile The Same As Market Profile?
Traders will often use the terms volume and market profiles interchangeably. However, there is a key difference between the two.
Market profiles look at how long a price traded at each level, making them time-based.
Volume profiles look at how many contracts or shares are traded at a given level, making them volume-based.

We also want to point out that volume profiles are related to but not the same as footprint charts.
Footprint charts dig into the volume at the bid and ask or similar measures within each period.
On the other hand, volume profiles look at the aggregate trading volume for a time period.
Identifying Support And Resistance Levels With Volume Profile
Volume profiles work well at identifying support and resistance levels as a reactive method. That means they rely on past price movements.
So, if you’re looking to try to find a spot above all-time highs in the market, volume profiles won’t be of much help.
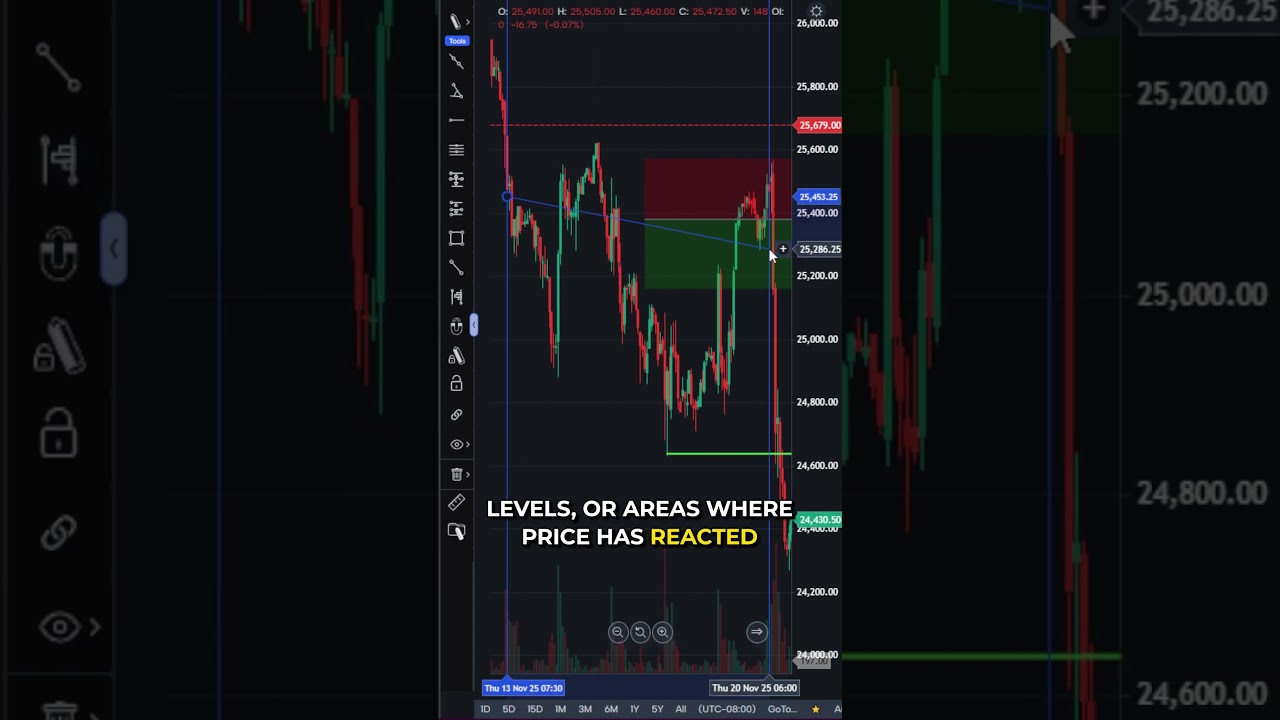
Traders often look for support and resistance areas at two key areas – high and low volume nodes.
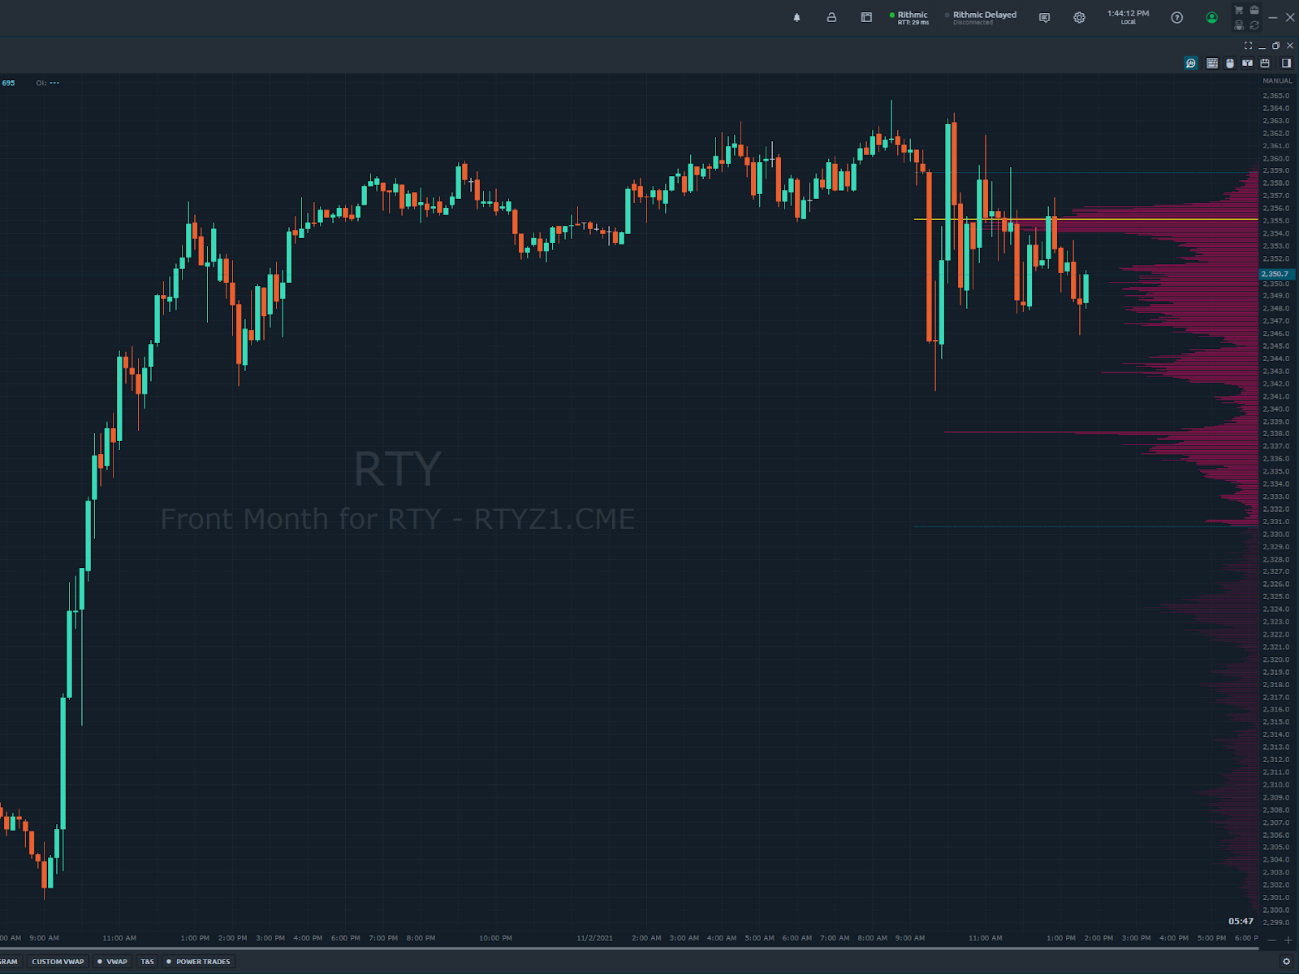
High volume nodes, like the point of control, are where heavy amounts of volume were traded. These can imply ‘fair value areas.’ In theory, markets are less likely to break through these areas.
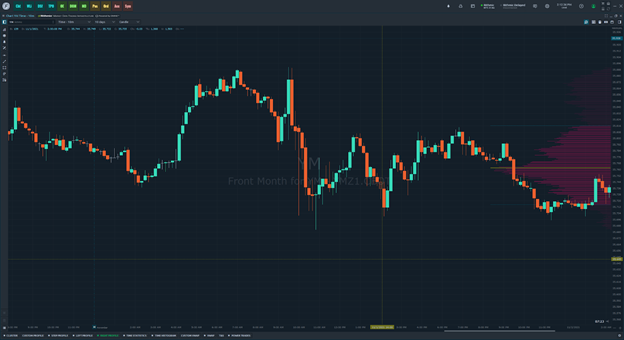
You can identify high volume nodes as peaks in the volume profile as shown below.

Low volume nodes are the opposite. These appear as valleys in the volume profile chart and represent points where less volume was traded. Low volume nodes can imply areas of discount or premium.
When markets approach these areas, they can be more likely to push through than other higher volume points in the volume profile.

Types of Volume Profiles
There are four main types (or shapes) of volume profiles: D, P, b, and B.
Each type corresponds to the distribution curve of the trading volume.
1: D-shaped Volume Profile
Inside a D-shaped profile, the highest level of trading volume occurs centrally. This indicates a balance between buyers and sellers. The price at which volume is greatest is known as the Point of Control (POC).
A D-shaped profile can indicate a market that lacks direction or is choppy. It can also mean a period of consolidation before a breakout as institutional players build a position (known as accumulation).
2: P-shaped Volume Profile
A P-shaped Volume profile occurs when the price rises and then consolidates around a new point of control. The lower thin part of the P-shaped profile shows a period of low trading volume. The wider upper part of the P-shaped profile shows a new ‘fair’ price (POC) between buyers and sellers. This increases trading activity and often indicates a bullish signal.
Typically, we expect to see a P-shaped profile near the highs or after a price run. When it occurs near the highs, that’s often a point where price takes some time to consolidate before continuing with the upward trend.
However, when we find a P-shaped profile near the lows, it can signal a short-covering rally or a reversal that can be used as a bullish catalyst to ride price higher.
3: b-shaped Volume Profile
The b-shaped profile is the opposite of a P-shape. The b-shaped profile represents a period of sell-off before the market settles on a new price. As with the P-shape, the volume of trading activity peaks as price re-balances. As noted, b-shaped profiles show a sell off period indicative of a bearish signal.
Like a P-shape in an uptrend, a b-shape in a downtrend is common and often points to an area of consolidation before price continues with a trend. Conversely, if we see a b-shape during an uptrend, it may indicate a reversal as bulls leave the market.
4: B-shaped Volume Profile
The B-shaped profile occurs when there are two D-shaped profiles inside the specified period. When analyzing B-shaped profiles, traders may separate them into disparate D-shaped profiles.
What makes B-shaped profiles unique is that we find high volume nodes at two different points in the range. This creates bookends for price to bounce between as it consolidates. When we find this after a recent trend, this can signal a pause before the trend continues. That’s why we want to take note of which node provides stronger support or resistance.
Volume Profile Trading Strategies
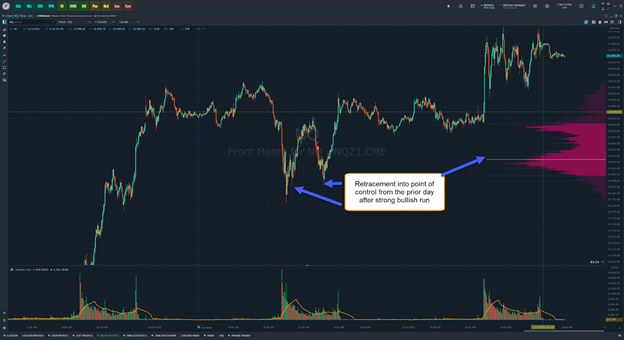
Bullish Retracement
Like many breakout trades, bullish retracements build on an existing trend. In this case, we look for a longer-term uptrend.
The premise is fairly simple. We want to use a strong upward thrust followed by a consolidation period.
Next, we look for a break over the range and a retest of the point of control. Also, we can look for a move from the top of the range into the point of control.
The point of control acts as a support level to buy the market for a long swing trade.
The chart below shows how the point of control from the previous day’s trading range acted as support for the next leg higher.
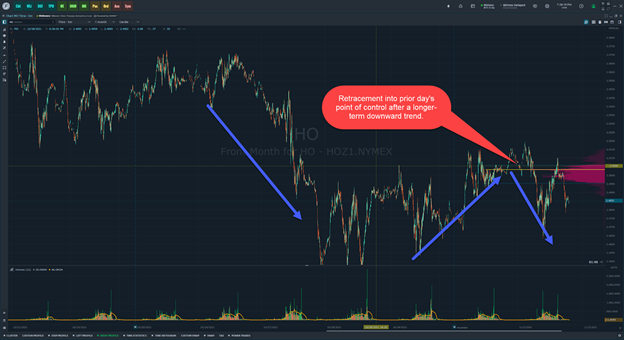
Bearish Retracement
On the flip side of the bullish retracement trade is the bearish alternative.
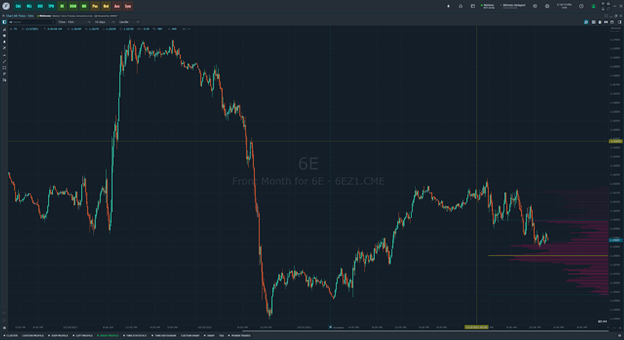
In the bearish alternative, we’re using the momentum of a strong downward move into a consolidation range as our focal point. We then want to use the point of control as a resistance level catalyst to hop on the next move lower.
Using the heating oil futures chart below, you can see how the previous day’s point of control acted as resistance when price came back into it. We can use that level as a spot to initiative a bearish position.
The Low Volume Fade
As mentioned, Volume profiles tell us which prices see the most and least amount of volume.
One way to take advantage of that is looking for setups where price climbs on low volume into a premium or discount low volume node.
To learn more about this strategy, check out Optimus Futures’ weekly trading ideas on TradingView. This week’s idea looks at spots where price climbs into a low volume node on low volume, setting up a fading opportunity.
Start Trading With Volume Profile
Open your free account today with Optimus Futures and unlock all the features of our flagship platform, Optimus Flow, right out of the gate.
You’ll gain access to a wealth of tools from real-time news feeds to volume and market profile charting at no additional cost. It even comes with an automated trading journal.
Plus, you can take unlimited simulated trades for up to 30 days.
Click here to learn more about Optimus Futures and the Optimus Flow Platform.
Trading futures and options involve substantial risk of loss and are not suitable for all investors. Past performance is not necessarily indicative of future results.