The Fibonacci tool is a very commonly used tool among traders, but one of the greatest functions of the Fibonacci tool is often neglected. Whereas most traders use the Fibonacci retracements to determine entries – which can be tricky because it is always unclear which Fibonacci level price will adhere to – the Fibonacci extensions are much less subjective. With the help of the Fibonacci extensions, identifying potential profit targets becomes very simple and it takes out a lot of guesswork.
What are Fibonacci extensions?
Whereas most traders only know about the regular Fibonacci retracement levels (0.382, 0.618 and 0.764), the Fibonacci extensions are levels that extend beyond current price. When it comes to Fibonacci extensions, there are mainly two levels traders need to be aware of: 1.382 and 1.618.
Once you have identified a trend-leg with a retracement (an A-B-C move), you can use the Fibonacci tool and the extensions project the 1.382 and the 1.618 levels onto your charts. Those two levels are then potential D price target levels.
All graphs are used for illustration only and not meant to imply any profit or loss.

The difference between 1.382 and 1.618
So which of the two price levels do you choose as potential take profit orders for your trades? There are three things a trader has to take into consideration when picking take profit orders:
First, the strength of the ongoing trend can help you make a decision between the two levels; in a market environment with less trend-strength, the 1.382 level often makes for safer take profits target as wide trend swings cannot be expected.

Second, your risk appetite determines the choice of your take profit level. A more conservative trader might choose 1.382 more often than a more aggressive trader who chooses the 1.618 level. Another option would be to use two different take profit orders and scale out over the two Fibonacci levels.

And finally, the depth of the Fibonacci retracement can provide information about the likelihood of price reaching the Fibonacci retracements. A very deep retracement often means that the trend lacks strength and momentum, and choosing the closer 1.382 can be the safer option. A C-retracement which is short and price reverses back into its original direction fast can mean that the trend is strong and the 1.618 is likely to happen.

How to use Fibonacci to time your trades
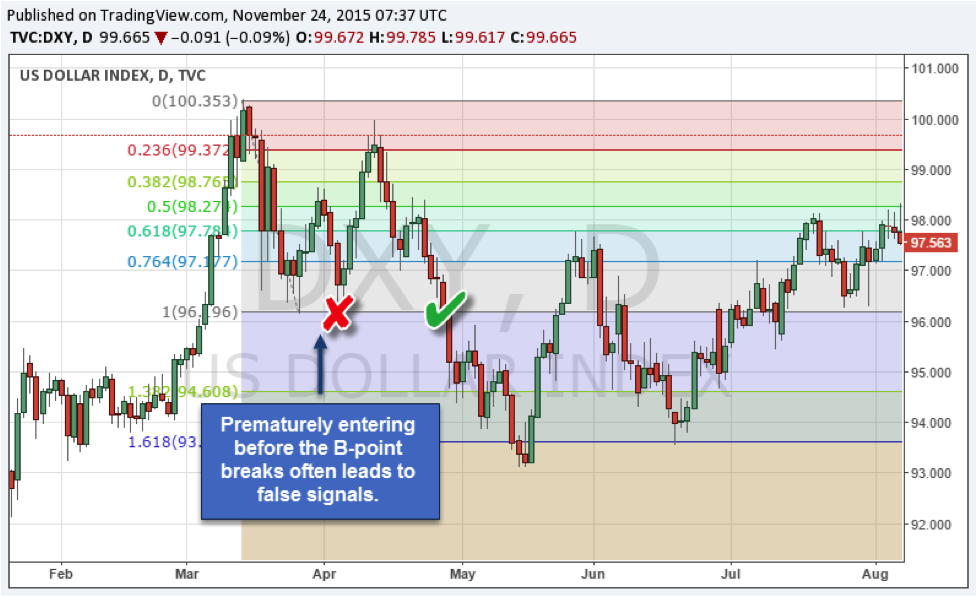
Traders often make the mistake of jumping the gun and immediately enter a trade after they can spot an A-B-C sequence. The problem with that is that at such a point, it is unclear if price will even break the C-point and make another run.
The safer option is usually to wait for a confirmed break of the B-point. However, in an established trend, more aggressive traders often choose to enter as soon as they can spot the A-B-C pattern which then provides a much larger (potential) reward to risk ratio. On the other hand, such premature entries usually lead to more false signals as well.
Another way to go about this is to look for Fibonacci sequences on the higher time-frames and then follow your regular trading system on the lower time-frames; the Fibonacci extensions then only serve as potential take profit areas and are not used as trade entry signals.
All graphs are used for illustration only and not meant to imply any profit or loss.
Conclusion: The Fibonacci tool helps you find better take profit targets
As we have shown you, there are many different ways how the Fibonacci extensions can help you find better ways to identify take profit areas. Especially if you are currently unsure about how to pick reasonable take-profit levels and are more or less just randomly choosing your trade exits, the Fibonacci extensions can help you eliminate the subjectivity in your trading approach. The following point sum up what we have discovered in this article:
- Wait for an A-B-C move to apply the Fibonacci extensions
- Wait for a confirmed break of B
- Entering before B has been broken can provide a better reward to risk ratio, but also leads to more false signals
- The 1.382 is the more conservative target and the 1.618 should be chosen in a strong trending environment
- The depth of the C-retracement can provide information about trend strength
- Fibonacci extensions on higher time-frames can be used as profit targets on lower time-frames
There is a risk of loss in futures and forex trading. Past performance is not indicative of future results.