Do your charts look cluttered with too many random lines? In this video, we simplify your analysis by identifying the 6 essential key levels in futures trading that actually provide market context.
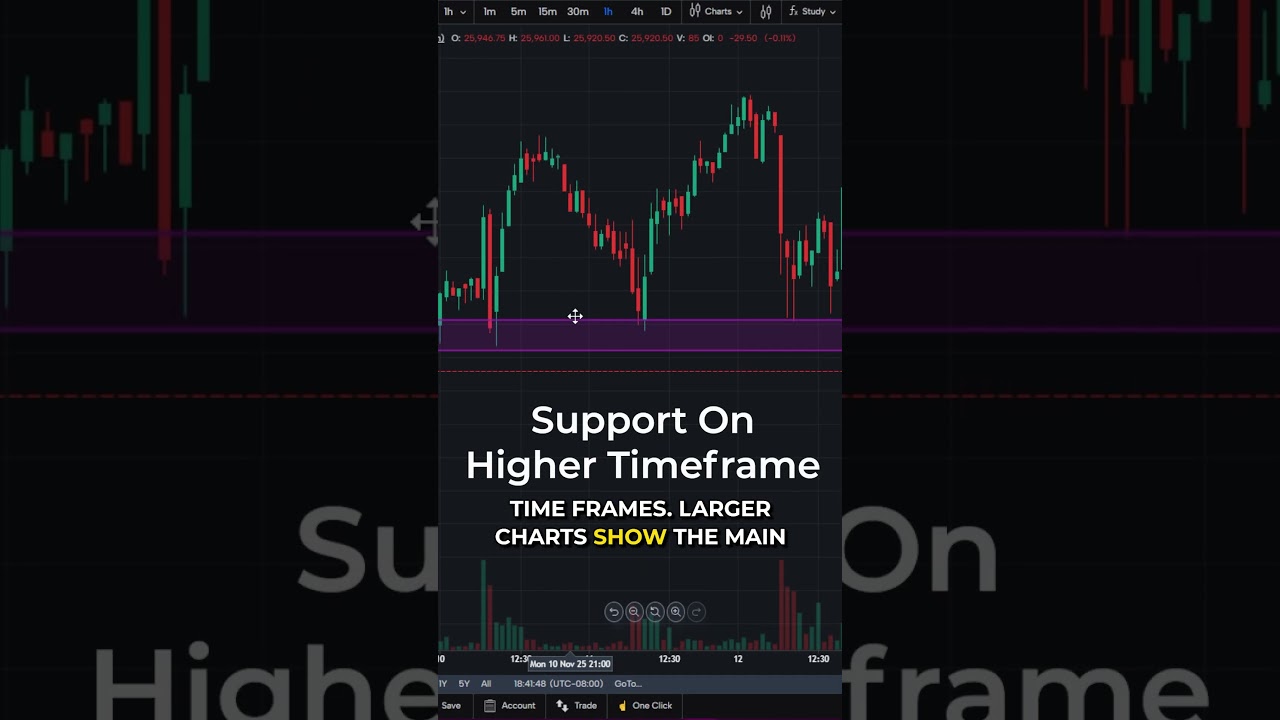
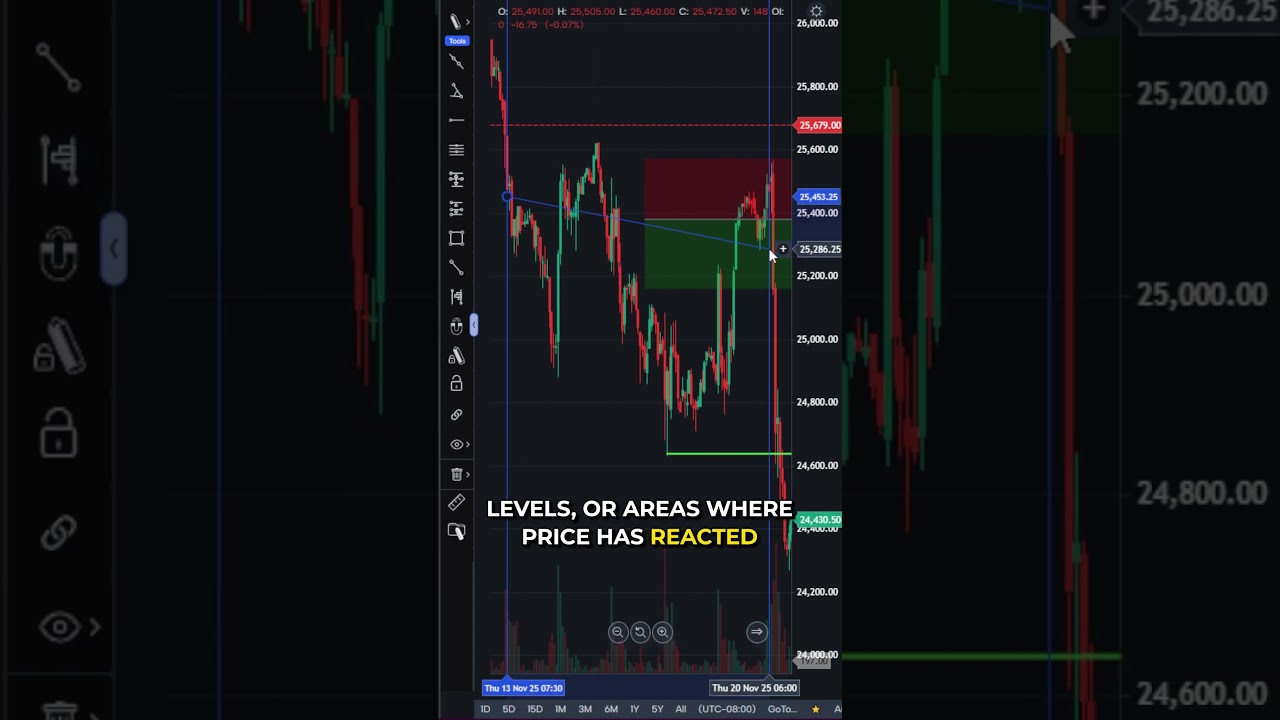
We walk through how to draw these levels correctly inside Optimus Futures Web, including Overnight Highs/Lows, Previous Day Highs/Lows, and Value Areas. These aren’t magic prediction lines—they are the structural roadmap where price has previously interacted.
In this video, you will learn:
• The “Big 6” Levels: Overnight High/Low, Previous Day High/Low, and Value Areas.
• Platform Tools: How to use the Horizontal Ray and Magnet tools for precision.
• Volume Profile: Using Fixed Range Volume Profile to find the Value Area High (VAH), Low (VAL), and POC.
• Context vs. Prediction: How to interpret price reactions around these levels without guessing.
• Routine: How to roll these levels forward from session to session.
Chapters
[00:00] Key levels and common charting pain points
[01:03] Overview of reference levels used
[01:12] Overnight high and low
[02:02] Previous day high and low (PDH / PDL)
[03:37] Previous day value high and value low
[05:09] Observing price behavior around levels
[07:45] Interpreting reactions and context
[09:38] Summary and practical considerations
Try Optimus Futures Web: You can explore these charting tools inside Optimus Futures Web at: https://demo.optimusfutures.com
Want to learn more about Optimus Futures? Visit our website: https://optimusfutures.com/
Learn to Trade Futures: https://learn.optimusfutures.com
Our commissions, margins, and pricing: https://optimusfutures.com/Futures-Trading-Pricing.php
Open an account with us today! https://optimusfutures.com/Futures-Commodities-Trading-Account.php
Please don’t forget to like the video, comment, and subscribe! THANKS FOR WATCHING!
There is a substantial risk of loss in futures trading. Past performance is not indicative of future results. When considering technical analysis, please remember educational charts are presented with the benefit of hindsight. Market conditions are always evolving, and technical trading theories and approaches may not always work as intended. The placement of contingent orders by you or broker, or trading advisor, such as a “stop-loss” or “stop-limit” order, will not necessarily limit your losses to the intended amounts, since market conditions may make it impossible to execute such orders. The high degree of leverage that is often obtainable in commodity interest trading can work against you as well as for you. The use of leverage can lead to large losses as well as gains. Optimus Futures, LLC is not affiliated with nor does it endorse any trading system, methodologies, newsletter, or other similar service. We urge you to conduct your own due diligence.