This article on Trading Sideways Markets is the opinion of Optimus Futures.
Unlocking Opportunities When the Trend Goes Nowhere
Picture this: you’re watching the markets, waiting for that big trending move, but instead, prices just bounce back and forth in what seems like an endless ping-pong match. Sound familiar? Welcome to range-bound markets—one of the most common yet misunderstood market conditions that futures traders encounter.
While many traders sit on the sidelines during these “boring” periods, savvy traders know that sideways markets, or range-bound markets, actually account for roughly 70% of all market conditions (opinion).
What Exactly Is a Sideways Market?
Think of a sideways market like a tennis match where the ball keeps bouncing between two players who never miss. In trading terms, this means prices move within a relatively predictable range, bouncing between a ceiling (resistance) and a floor (support) without breaking decisively higher or lower.
These periods typically happen when the market is digesting information or waiting for the next major catalyst. Instead of making dramatic moves up or down, prices oscillate in a horizontal channel while buyers and sellers battle for control.
Here’s what makes sideways markets unique: they often have clear boundaries that prices respect repeatedly, volume tends to be relatively quiet until something changes, and neither the bulls nor bears can gain a decisive advantage for extended periods.
Why Sideways Markets Are Tradable As well
Here’s a secret that experienced traders know but beginners often overlook: sideways markets can be potentially more predictable than trending markets. When you know where the boundaries are, you can plan your trades with greater confidence.
Think about it this way—in a trending market, you never know when the trend might reverse or how far it might go. But in a sideways market, you have clearly defined profit targets and risk levels. It’s like playing basketball on a court with clearly marked boundaries versus playing on a field with no lines.
These consolidation periods also typically occur during specific market conditions. You’ll often see them after major economic announcements when institutions are digesting new information, during holiday periods when fewer traders are active, or between earnings seasons when fundamental catalysts are limited.
Spotting Sideways Markets
The good news is that identifying sideways markets doesn’t require a PhD in rocket science. With Optimus Flow’s advanced charting capabilities, you can spot these opportunities across multiple timeframes simultaneously.
The Visual Approach
Start by looking at your charts and asking yourself a simple question: “Are prices making higher highs and higher lows, or are they stuck between two horizontal lines?” If it’s the latter, you’re likely looking at a sideways market.
Optimus Flow comes with over 50 pre-built indicators that can help confirm what your eyes are seeing. Here are the most useful ones for identifying range-bound conditions:
- Average Directional Index (ADX): When it drops below 25, it often signals that the market lacks clear direction
- Bollinger Bands: Bands squeezing together suggest decreasing volatility, common in sideways markets
- Volume Analysis: Optimus Flow’s free tools help you spot when volume drops during consolidation periods
Reading the Order Flow
This is where Optimus Flow’s unique DOM Surface panel becomes invaluable. Unlike basic charting packages, this feature displays all buying and selling activity in real-time.
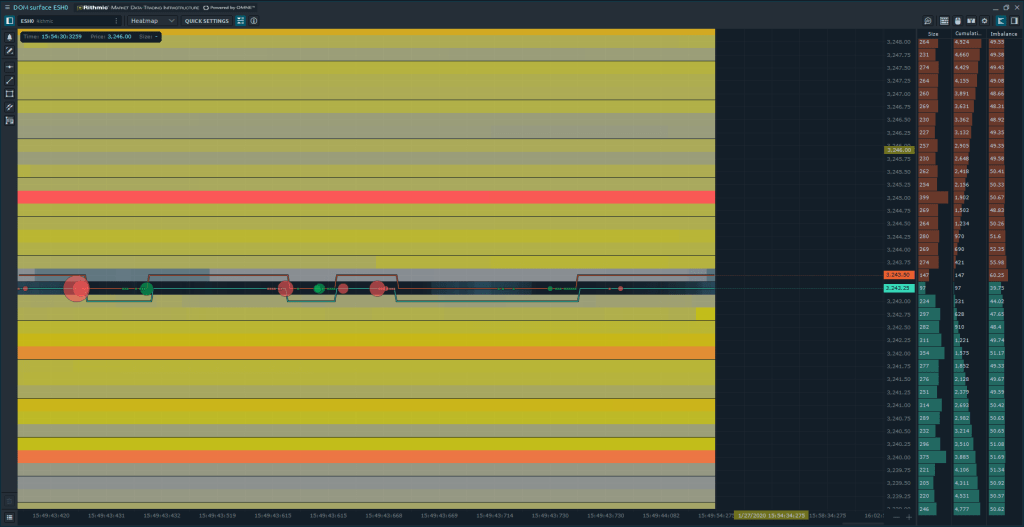
In range-bound markets, you’ll notice something interesting: liquidity tends to cluster at the support and resistance levels, and you can actually see when large orders are being absorbed without moving prices significantly.
The platform’s volume analysis tools (which come free with your account) help you understand when volume drops during range-bound periods versus when it spikes, potentially signaling an upcoming breakout.
Range Bound Trading Strategies
Strategy 1: The Bounce Play – Early vs. Late Entry
This is the bread and butter of range-bound market trading, and it’s simple enough for beginners yet sophisticated enough for professionals. However, timing your entry can make the difference between consistent profits and frustrating losses.
Disclaimer: The following is a hypothetical example for educational purposes only and should not be considered a trade recommendation. All trading involves substantial risk of loss.
Let’s say the E-mini S&P 500 (ES) has been bouncing between 4,200 and 4,250 for two weeks. You have two main approaches for timing your entries:
Early Entry Approach: You enter as prices approach the range boundaries—buying at 4,205 (just above support) before any confirmation of a bounce. This gives you better risk-reward since your stop can sit tight at 4,195, offering a 10-point risk for a potential 40-point reward.
Late Entry Approach:
You wait for confirmation—perhaps a strong rejection candle off 4,200 support or clear buying volume before entering at 4,210. Your stop might need to be wider at 4,190, but you have higher confidence the level will hold.
Here’s how these approaches typically compare in range-bound markets:

Through Optimus Futures’ advanced order management system in Optimus Flow, you can set up bracket orders for both approaches. The key insight comes from monitoring the DOM panel for order flow exhaustion and utilizing the platform’s volume analysis to identify when large orders are being absorbed at key levels, although this is purely an educational observation and not trading advice.
Critical Rule: Avoid trading in the middle of the range where direction is unclear. Stick to the edges where the probabilities are in your favor.
Strategy 2: Volume Profile Mastery

This strategy separates beginners from intermediate traders, but don’t worry—it’s easier to understand than it sounds.
Disclaimer: This is a hypothetical scenario for educational purposes only. Past performance is not indicative of future results. Trading futures involves substantial risk of loss.
Imagine the Micro E-mini NASDAQ (MNQ) trading between 15,800 and 16,200 for two weeks. Using Optimus Flow’s free volume analysis tools, you can identify what traders call the “Point of Control”—essentially the price level where most trading activity occurs.
Let’s say this level is at 16,000. Your strategy becomes simple: when prices move to the extremes of the range (16,180 near resistance), you look for opportunities to trade back toward the high-volume area at 16,000.
Optimus Flow’s Power Trades feature takes this a step further by highlighting when large institutional orders are being executed in real-time. This helps you spot accumulation at support levels before bounces occur, or distribution at resistance before reversals—though remember, these are educational observations only.
Strategy 3: Breakout Preparation and Volume Warnings
Experienced traders know that sideways markets don’t last forever. Eventually, something gives way, and when it does, the moves can be potentially explosive. The key is recognizing the warning signs before the breakout occurs.
Disclaimer: The following example is for educational purposes only and should not be construed as trading advice. Market conditions can change rapidly, and past patterns do not guarantee future results.
Consider the E-mini NASDAQ (NQ) consolidating between 14,500 and 15,000. Seasoned traders prepare for the eventual breakout by watching for these signals:
Volume Spike Warning System: Optimus Flow’s volume analysis tools help you spot when volume suddenly increases near range boundaries. This often signals either a genuine breakout or a “trap move” where institutions are testing the waters. When you see unusual volume at 14,480 support or 15,020 resistance, it’s time to pay attention.
Range Tightening Signals: Observe the range as it gradually narrows over time. If NQ starts trading between 14,600 and 14,900 instead of the original 14,500-15,000 range, pressure is building for a significant move.
Position Sizing for Compressed Volatility: In tight ranges, volatility is compressed, so adjust your position sizes accordingly. You might consider trading a smaller size during the range phase, then increasing your position size when the breakout actually occurs.
The key is position sizing—never risk more than 1%-2% of your account on each direction(opinion). Optimus Flow’s Market Replay feature enables you to backtest how similar setups have historically performed, providing confidence in your approach without risking real money.
Advanced traders utilize Optimus Flow’s TPO Profile analysis to identify where prices have spent the most time, which helps predict the direction the eventual breakout might favor.
The Technology Advantage
Why Optimus Flow Makes the Difference
What separates successful sideways market traders from the rest often comes down to having the right tools. Optimus Flow provides several features that are particularly valuable for range-bound trading.
The unlimited simulation environment lets you practice these strategies using real market data without risking actual money.
The Market Replay feature allows you to backtest your ideas using historical tick-by-tick data, so you can see exactly how your strategies would have performed.
For Optimus Futures customers, the platform includes a free trading journal with automatic trade synchronization. This means every trade gets logged automatically, helping you track your performance and identify what’s working and what isn’t.
The Time & Sales panel displays every trade being executed in real-time, enabling you to understand the order flow at key support and resistance levels. Historical Time & Sales enables you to analyze specific price bars and understand how markets typically react at range boundaries.

The Working Orders panel keeps track of all your pending trades, while the Positions panel provides real-time profit and loss information. These may sound like advanced features, but they’re designed to be intuitive enough for newer traders while sophisticated enough for professionals.
Setting Up Your Futures Trading Platform
Platform Configuration Made Easy
Important Disclaimer: All examples and strategies discussed are for educational purposes only. Trading futures involves substantial risk of loss and is not suitable for all investors. Past performance is not indicative of future results.
Getting started with range-bound market trading on Optimus Flow doesn’t require a degree in computer science. The platform organizes everything into logical categories that make sense.
Here’s a simple setup process that works for both beginners and experienced traders:
- Analytics Panels: Set up your main chart with multiple timeframes (1-hour and 5-minute work well for ES/NQ trading) and add the Time & Sales panel for real-time order flow monitoring
- Trading Panels: Configure your Working Orders panel for managing pending trades and the Positions panel for real-time P&L tracking
- Risk Management: Enable the automated Trading Journal and set up custom alerts for key support and resistance levels
- Workspace Layout: Arrange your primary chart showing the 1-hour timeframe with clear support and resistance levels, a secondary 5-minute chart for precise entries, and position your order management panels where you can easily monitor them
The Bigger Picture
Balancing Opportunities and Challenges
Sideways market trading offers clear advantages: you get well-defined entry and exit points, lower exposure to overnight gap risk, and strategies that work well with smaller account sizes. However, it also presents challenges, including higher transaction costs from more frequent trading and the need for active monitoring.
Here’s how the key benefits and challenges break down, along with how Optimus Futures addresses each concern:
| Benefit | Challenge | Optimus Futures Solution |
|---|---|---|
| Clear entry/exit points | Higher transaction costs | $0.25 micro futures commissions |
| Lower exposure to gap risk | Time-consuming monitoring | Custom alerts and notifications |
| Predictable profit targets | Risk of false breakouts | Free DOM Surface for order flow analysis |
| Suitable for smaller accounts | Requires active management | Free Mobile App for on-the-go trading |
The key is understanding that false breakouts will happen and having the discipline to stick to your risk management rules when they do.
Your Next Steps
Sideways markets are not obstacles to avoid—they’re opportunities to embrace. With clear strategies, disciplined risk management, and professional-grade tools like Optimus Flow from Optimus Futures, range-bound periods can become a consistent source of potential trading opportunities.
The key is preparation, patience, and disciplined execution. Whether you’re a beginner learning the basics or an experienced trader looking to refine your approach, the strategies and tools discussed here can help you navigate sideways markets with greater confidence.
Ready to navigate sideways markets? Open an account with Optimus Futures, start with our free simulation environment, and practice your strategies using Optimus Flow. When you’re ready, execute with confidence using our professional-grade platform and comprehensive brokerage services.
Important Risk Disclaimers:
Futures trading involves substantial risk of loss and is not suitable for all investors. The high degree of leverage that is often obtainable in futures trading can work against you as well as for you. Past performance is not indicative of future results. All examples and strategies discussed in this article are for educational and illustrative purposes only and should not be construed as trading recommendations or investment advice.
The placement of contingent orders, such as stop-loss orders, will not necessarily limit your losses to the intended amounts, since market conditions may make it impossible to execute such orders. Please trade carefully and at your own discretion.