Numbers Bars With SierraChart
Want to view additional data like Volume Delta, total volume, and more on your charts? Try using Numbers Bars to see not only price movement but important market metrics. Take a look at this video how to get Sierra Chart set up with Numbers Bars.
To receive a demo of Sierra chart please go here: https://optimusfutures.com/Platforms/SierraChart.php
From Sierra https://www.sierrachart.com/index.php?page=doc/doc_NumbersBars.php#Introduction
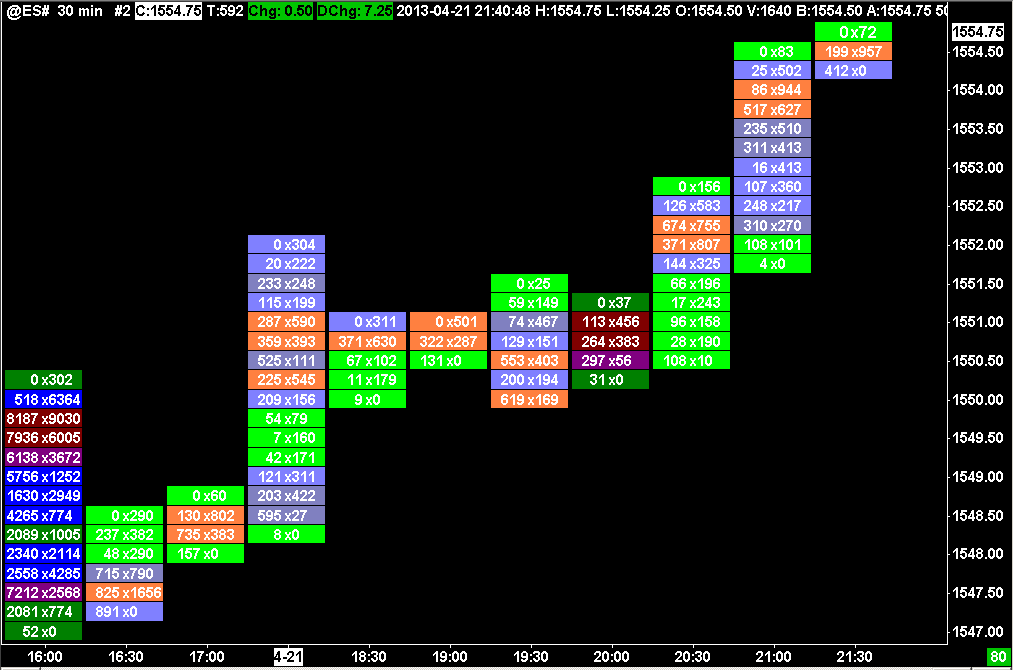
The Numbers Bars feature in Sierra Chart is a study that provides a very detailed view of the volume and trading activity within each individual bar in the chart. The regular price bars are replaced with up to 3 columns of numbers. There is a separate number or pair of numbers for each price level for each bar/column in the chart detailing the volume activity at that price level.
The numbers within a Numbers Bar can represent the difference between the Ask Volume and Bid Volume at each price level, the total Volume or number of Trades at each price level, the Ask Volume and Bid Volume at each price level, or other values. These bars reveal very detailed trading activity within a bar.
The Numbers Bars study can be configured to display multiple columns of data for each price bar. Each column can be configured to display different data. For example, the difference or Delta between Ask Volume and Bid Volume, and another column can be configured to display the Ask Volume and Bid Volume individually.
The Numbers Bar study is highly configurable and there are numerous coloring options.
TRADING FUTURES AND OPTIONS INVOLVES SUBSTANTIAL RISK OF LOSS AND IS NOT SUITABLE FOR ALL INVESTORS. THE USE OF STOP LOSS OR CONTINGENT ORDERS MAY NOT PROTECT PROFITS OR LIMIT LOSSES TO THE AMOUNT INTENTED. CERTAIN MARKET CONDITIONS MAY MAKE IT DIFFICULT OR IMPOSSIBLE TO EXECUTE SUCH ORDERS. PAST PERFORMANCE IS NOT NECESSARILY INDICATIVE OF FUTURE RESULTS.