Price rarely moves in one straight line from point A to point B. Consolidations and ranges are common price patterns and they can make it hard for traders to find trade entries or stay in trades. Knowing how to differentiate between different market phases and picking the right tools and concepts to make trading decisions is an important characteristic of a good trader.
In this article, we discuss technical analysis and the indicators that can help you analyze charts, highlighting their most important concepts in general. The strategies we introduce here may not be new to you as a trader, however, when used together in the right combination, you may be able to refine your process of execution and risk management.
-
Naked Charting and Price Analysis
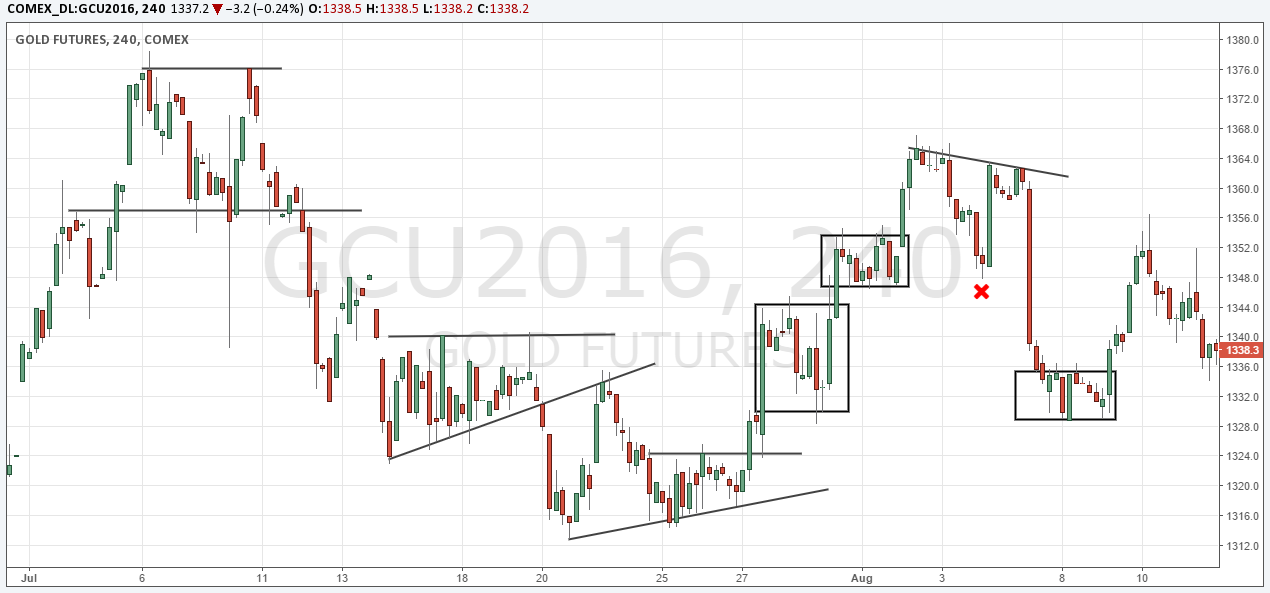
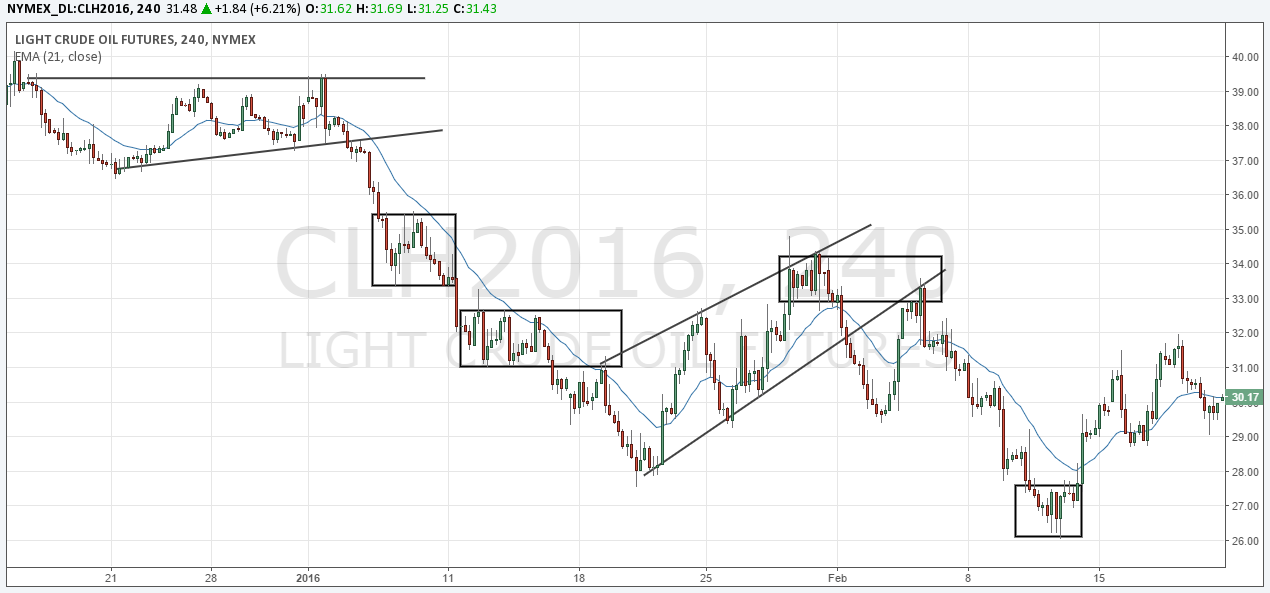
At the core of all good chart analysis stand (naked) price analysis. In the annotated chart below you can see how price goes from consolidation phases into trending phases and then back to consolidations. The consolidations come in different forms and shapes; rectangle boxes, wedges and triangles are the most common ones.
Multi-candle chart formations usually carry more weight than single candlestick patterns because they provide more information over a longer period – context is king when it comes to price analysis.
To start with, traders would look for buying opportunities when price breaks above a resistance level and look for selling opportunities when price breaks below a support level. In the next steps we will show you how to refine this process and how to improve your chart reading and trade filtering skills by using other tools.
-
Moving Averages
Many traders add moving averages to their charts to potentially improve the quality of chart analysis and their understanding of price movements. Moving averages are great tools and easy to use and interpret.
The standard rule is that a trader only looks for selling opportunities when price is below the moving average and for buying opportunities when price is above the moving average. The length of the moving average is usually determined by the individual trading style and the holding horizon – a short term trader would use a shorter moving average while a longer term swing trader usually uses higher settings for his moving averages.
In the screenshot below we can already see that the quality of signals has improved; during a downtrend (when price is below the moving average) a trader only looks for breaks of support levels for selling opportunities. A break of a resistance level would be ignored as long as price is below a moving average.
Following such an approach, a trader can potentially find re-entry opportunities for existing trades or improve his trade management strategy by applying moving averages to his charts.
-
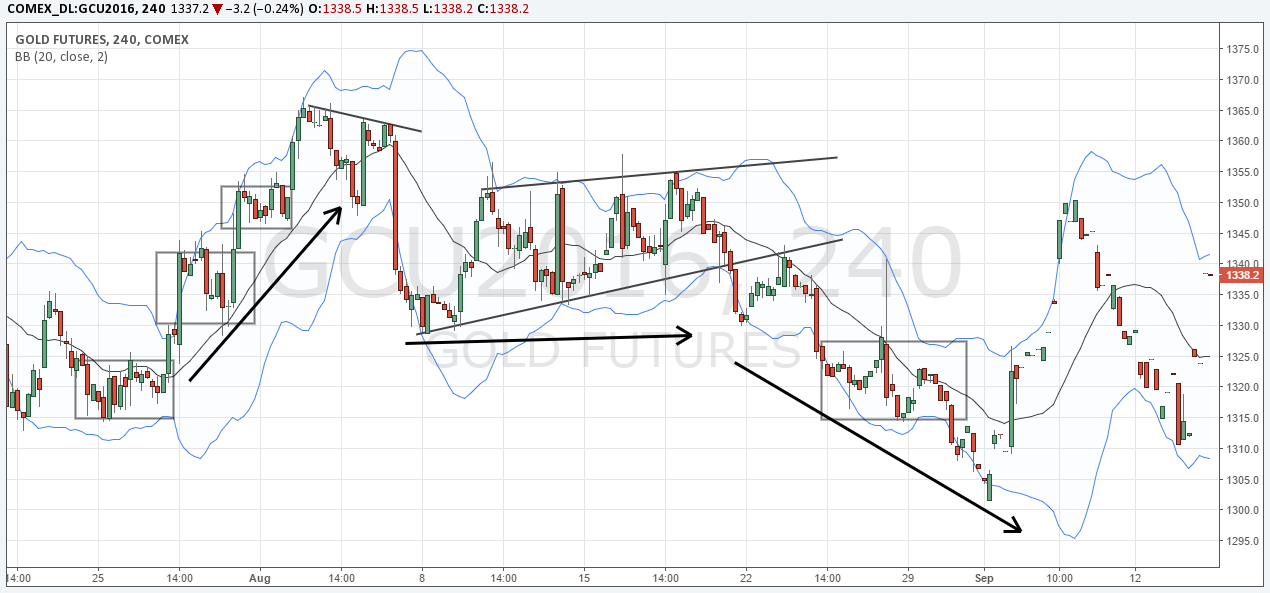
Bollinger Bands
Bollinger Bands are an extension to moving averages. The inner band is a moving average and the outer bands are volatility based and adjust based on changing market conditions.
The moving average in the center, as explained below, determines the market direction and acts as a first filter. The outer bands provide even more context and can be used to analyze momentum.
When price is able to trend close to the outer Bands, it shows a strong and healthy trend. When, during a trend, price suddenly fails to reach the outer band, it can signal fading momentum. A sudden spike beyond the outer bands which is followed by an immediate turnaround can foreshadow a potential reversal once the moving average is also broken.
-
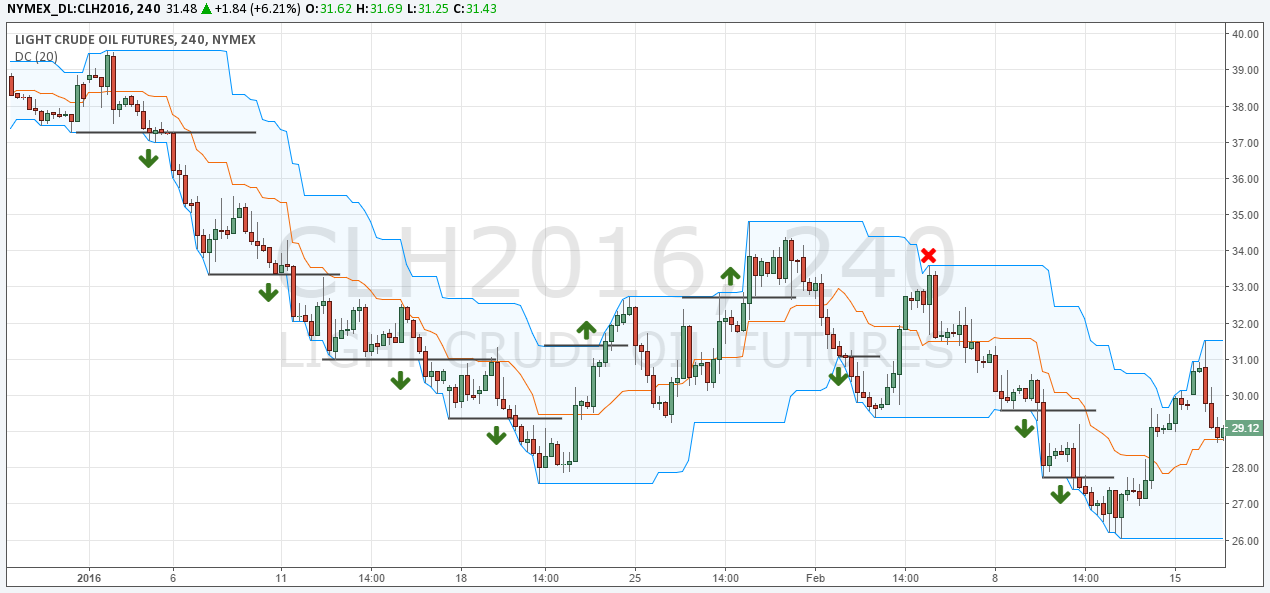
Donchian Channel
The Donchian channel visualizes the 20-day (or 20 period) range on your charts; the upper channel shows the 20 day high and the lower channel shows the absolute low over the past 20 days. The application differs slightly compared to the Bollinger Bands.
The Donchian channel is mostly used by breakout and trend-following traders. A trader would look for selling opportunities when the lower Band is broken and when price makes a new low. The theory behind the Donchian channel is that selling momentum increases once price breaks a multi-day low – and vice versa for bullish breakouts.
In the chart below you can see that, during trending phases, the Donchian channel can potentially be used to ride trends for a long period. During range markets however, price usually doesn’t reach the outer bands as easily.
Using just one indicator may not always point you in the right direction, but using a combination of the ones mentioned above may serve as a potentially better filter mechanism for executing your trades. However, it also important not to go “overboard” with the number of indicators you use in your trading arsenal, which may lead to “analysis paralysis”.
There is a substantial risk of loss in futures trading. Past performance is not indicative of future results.