Renko charts are an often overlooked way of analyzing price data and charting markets. Renko charts eliminate the time component of trading and only focus on the price itself. Potentially, Renko charts can filter out a lot of the market noise and display the price in a much more organized way that is simpler to interpret.
Renko Charts 101
Conventional candlestick charts print a new candlestick every hour, 4 hours, day, week or another time interval the trader chooses as his period setting. Renko charts, on the other hand, are not time-based and they don’t use candlesticks, but “bricks.” A Renko chart prints a new brick every X points. A trader might set 1 Renko brick equal to 10 points which mean that the Renko chart will show him a new brick every time price has moved 10 points in one direction.
The screenshot below compares the same chart over the same time horizon using traditional candlesticks and Renko charts. Although the charts look different at first glance, they show the same price action. Renko can help traders de-clutter their charts and allow for a simplified decision-making process as we will see shortly.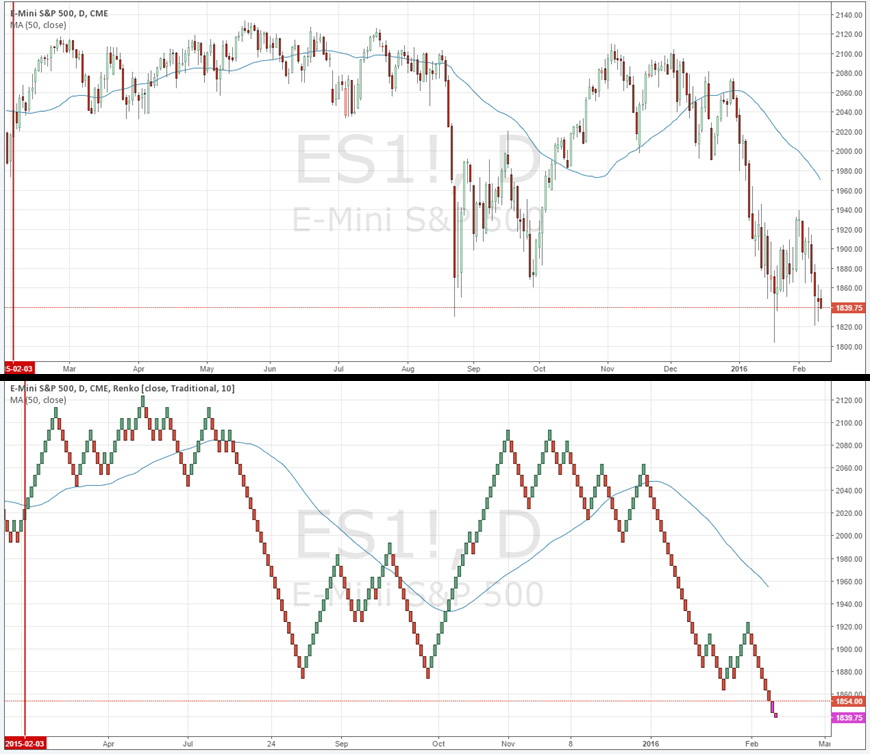 Chart Courtesy of TradingView
The pros of using Renko charts
#1 No arbitrary use of time
The component of time in trading can often distort price movements. Renko charts only focus on price as the primary factor of chart analysis. The vertically marked lines in the Renko chart below separate monthly periods. It is evident that the first periods on the far left are much shorter than the one on the right. This means that during the first month’s volatility was low and the price stayed in tight consolidations. On the right, price trended much more and showed more overall volatility and the Renko charts printed more bricks which lead to longer periods and more data.
Traders who struggle with patience could benefit from using Renko charts when they are presented with fewer bricks during inactive times.
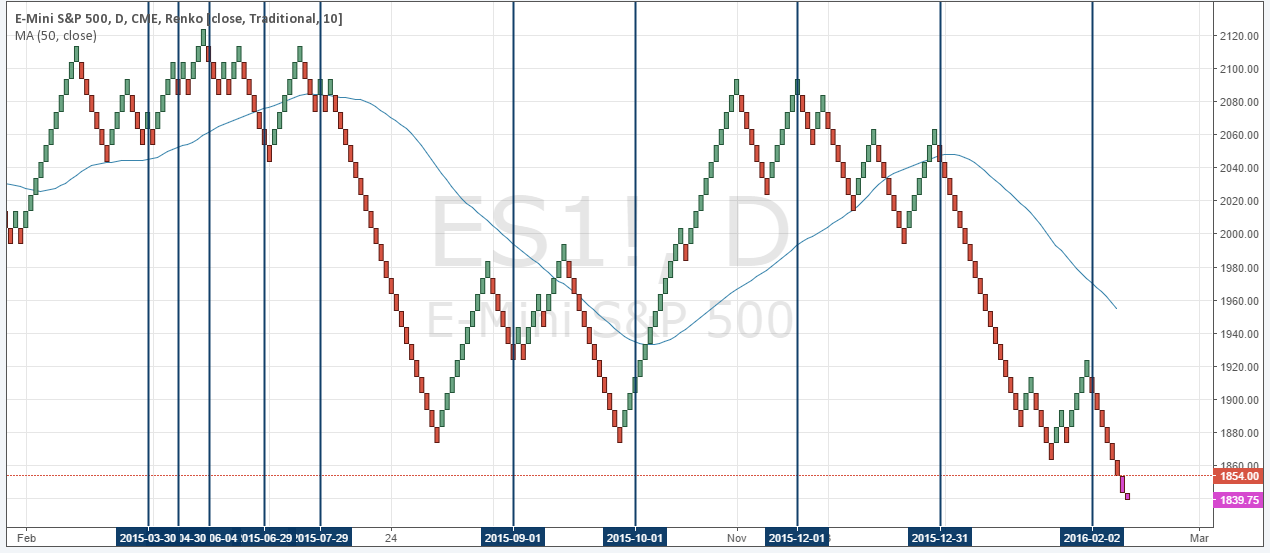 Chart Courtesy of TradingView
#2 Renko can eliminate noise
Renko charts are much cleaner than regular price action charts. Again, traders who struggle with patience and over-trading could benefit from Renko charts because they are presented with less information to act upon. When volatility is low, and momentum is non-existent, Renko traders simply sit it out.
#3 Technical analysis efficiency
The cleanliness of Renko charts can help technical traders understand price moves in a more efficient way. Consolidations and trends are much clearer, swing highs and lows are also easy to spot, and breakouts are immediately visible as well.
Renko charts can help traders establish a more objective and repeatable approach 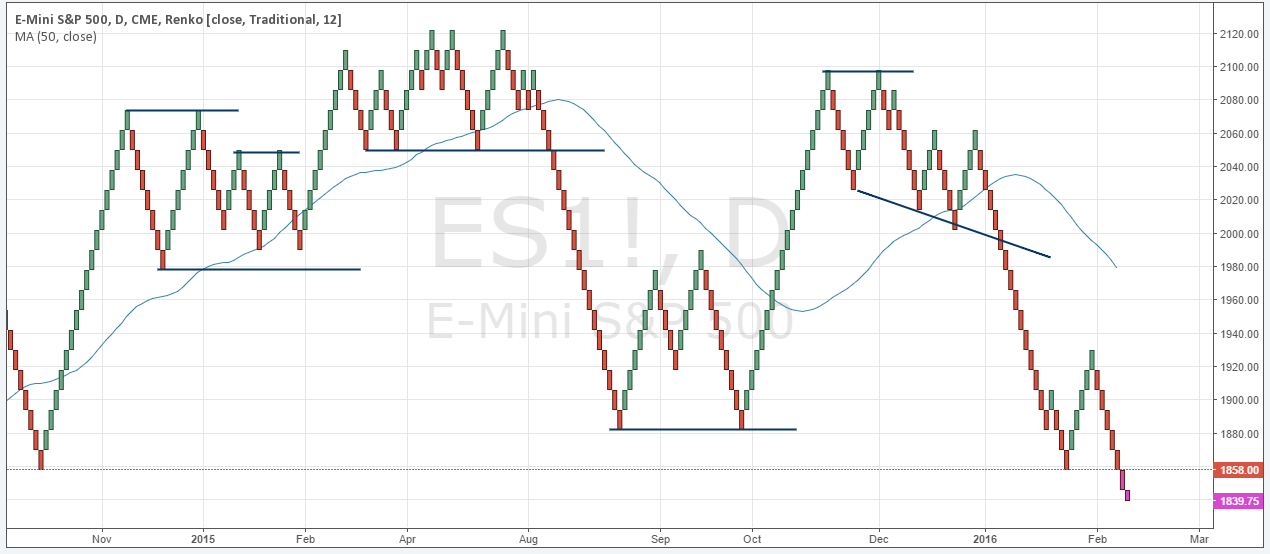 Chart Courtesy of TradingView
#4 Swing and trend trading
Especially for trend trading, Renko charts could be a good alternative. Trends are easy to spot and swing points stand out as well. Another benefit is that at the end of a trend, when price enters a distribution and consolidation phase, Renko charts show the shift nicely when they go from smooth trending to more up and down. Re-entering pullbacks during trending periods is another aspect Renko charts can help traders with – the support and resistance levels are much clearer defined, and there is a little noise on Renko charts.
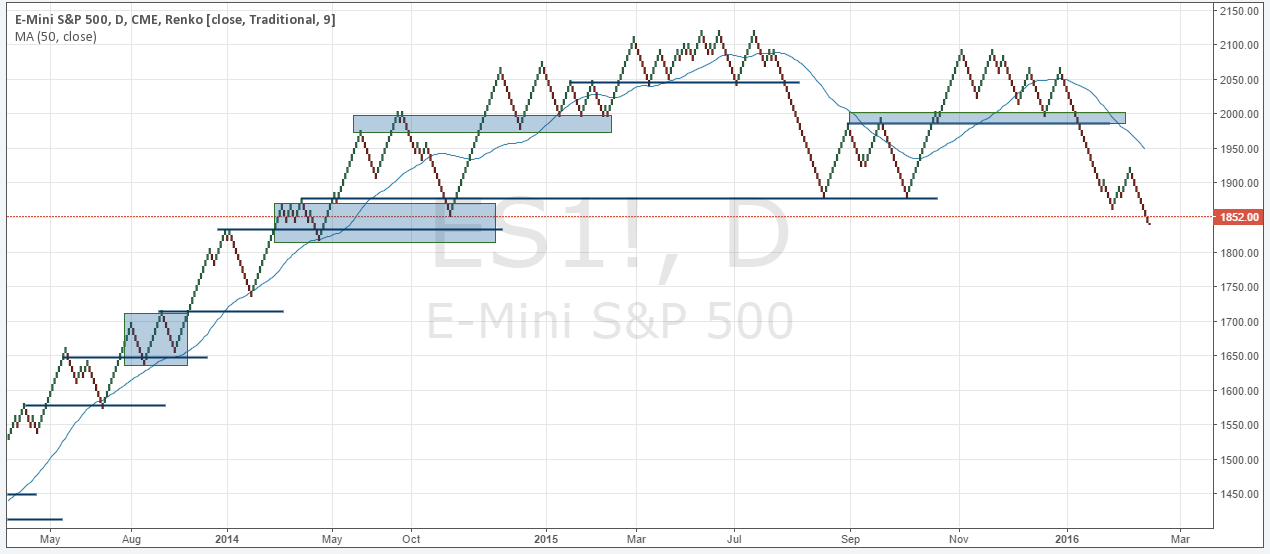 Chart Courtesy of TradingView
The cons of Renko charts
#1 The issue of brick settings
The first question all Renko traders ask is which point setting to use. As with most things in trading, there is no one size fits all and it depends on the individual trader and his style. A shorter setting will show more bricks and add more noise, but it could be possible to react faster to price shifts. A longer setting filters out more noise, but you could get signals late when bricks take a longer time to form.
With the new Renko charts, you can now apply the ATR setting; instead of a fixed brick points setting, the bricks adjust based on current volatility. The ATR Renko chart is probably the best solution as it accounts for changing market conditions while offering all the benefits of traditional Renko charts.
#2 More monitoring required
Renko charts require more active monitoring, especially for day traders. Since Renko charts are volatility sensitive, especially when using the ATR Renko, the price structure on your charts can change quickly. Hence, Renko charts are typically recommended for longer term traders or swing traders. Renko charts work well with the swing and trend following approach because they can filter out a lot of the noise which often scares traders out of their position and leads to impulsive mistakes.
Renko charts are worth exploring
Renko charts are often overlooked, but they can be of great help for different trader styles. Furthermore, they can help traders deal with emotionally related issues such as a lack of patience, over trading and impulsive errors. Taking out the time component and exclusively focusing on price alone can potentially add clarity and efficiency.
Looking for platforms that allow you to trade Futures with Renko?
There is a risk of loss in futures trading. Past performance is not indicative of future results.