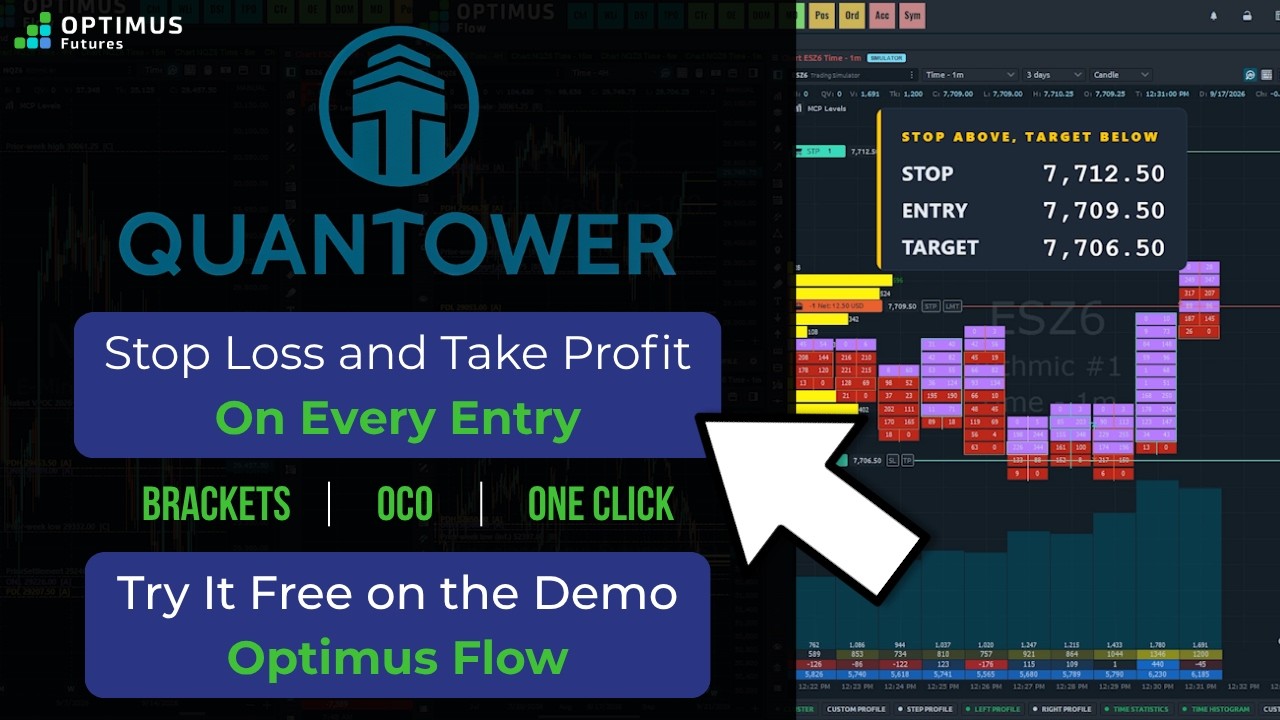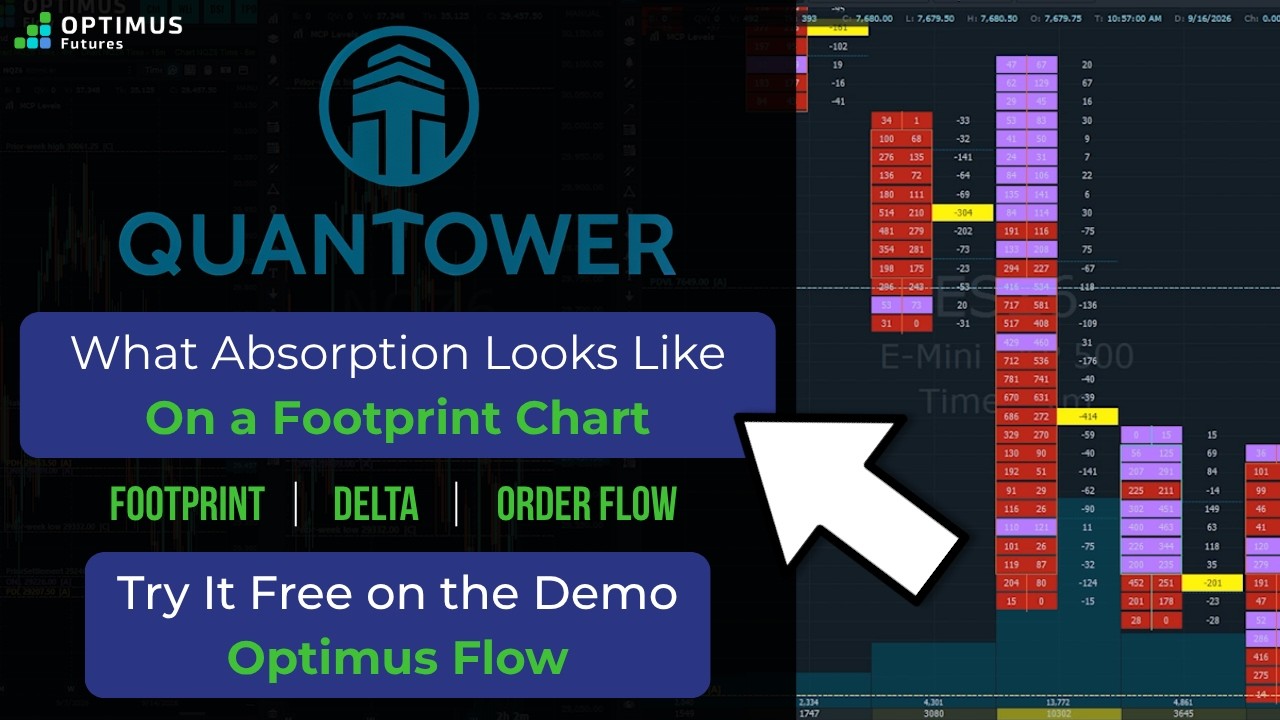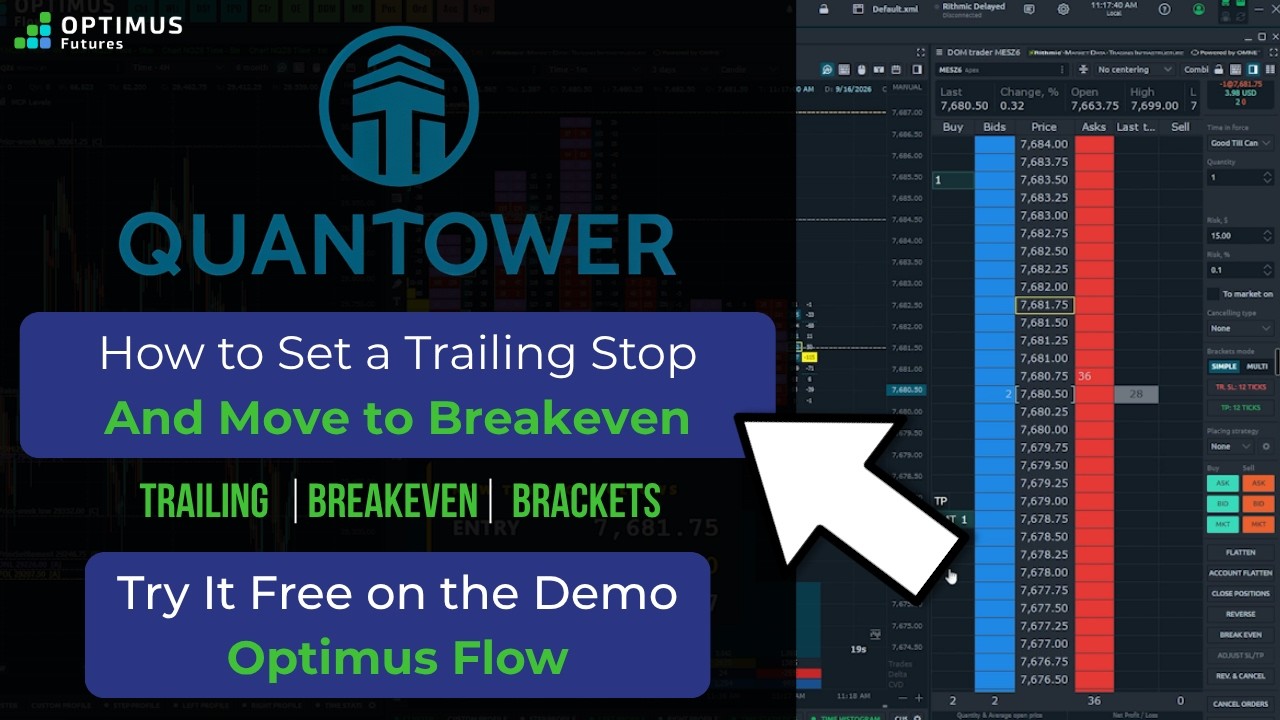
Cluster Charts are a powerful order flow tool that allows you to see every transaction at every tick level within each candle.
This lets traders identify imbalances, place tighter stop losses, and view the aggressiveness of market participants.
All the illustrations in this video can be viewed on our trading platform, Optimus Flow: https://optimusfutures.com/OptimusFlow.php
________________________________________________________________________________________________
Want to learn more about Optimus Futures? Visit our website: http://www.optimusfutures.com/
Our commissions, margins, and pricing: https://optimusfutures.com/Futures-Tr…
Open an account with us today! https://optimusfutures.com/Futures-Co…
Check out our community forum: https://community.optimusfutures.com/
Please don’t forget to like the video, comment, and subscribe!
THANKS FOR WATCHING!
________________________________________________________________________________________________
There is a substantial risk of loss in futures trading. Past performance is not indicative of future results. When considering technical analysis, please remember educational charts are presented with the benefit of hindsight. Market conditions are always evolving, and technical trading theories and approaches may not always work as intended.
#ClusterCharts #FootPrintCharts #OptimusFlow