In order to make the best trading decisions and trade at your optimal level, you must choose your tools wisely. This involves understanding the differences and benefits of the various charting methods. In this article, we will explore the differences between candlestick charts, line graphs and point and figure charts and look at the advantages and disadvantages of each method and which trading style goes best with each chart.
Candlestick Charts
Many traders use Japanese candlesticks, bar charts, renko, etc. However, in our opinion, for many futures traders, Candlestick charts provide the most information out of any chart type. At the same time, it can also be overwhelming and confusing if a trader doesn’t know how to interpret and read the specific candle formation. As a trader gains more real time screen experience, he/she will memorize these formations and potentially be able to apply a better analysis to the charts.
A candlestick provides you with information about momentum when you compare the length and the position of the bodies. You can analyze volatility by using the wicks and the size of the individual candlestick wicks.
Do you need to know all the candle chart formation? It helps but, many beginner traders experience a sense of paralysis by analysis when confronted with so much information. This is where the addition of line graphs or point and figure charts can help such traders gain more clarity.
Line Graphs
Line graphs provide significantly less information about price because it only connects the closing prices of the given interval. Thus, a line graph filters out a lot of the noise which exists in the candlestick charts.
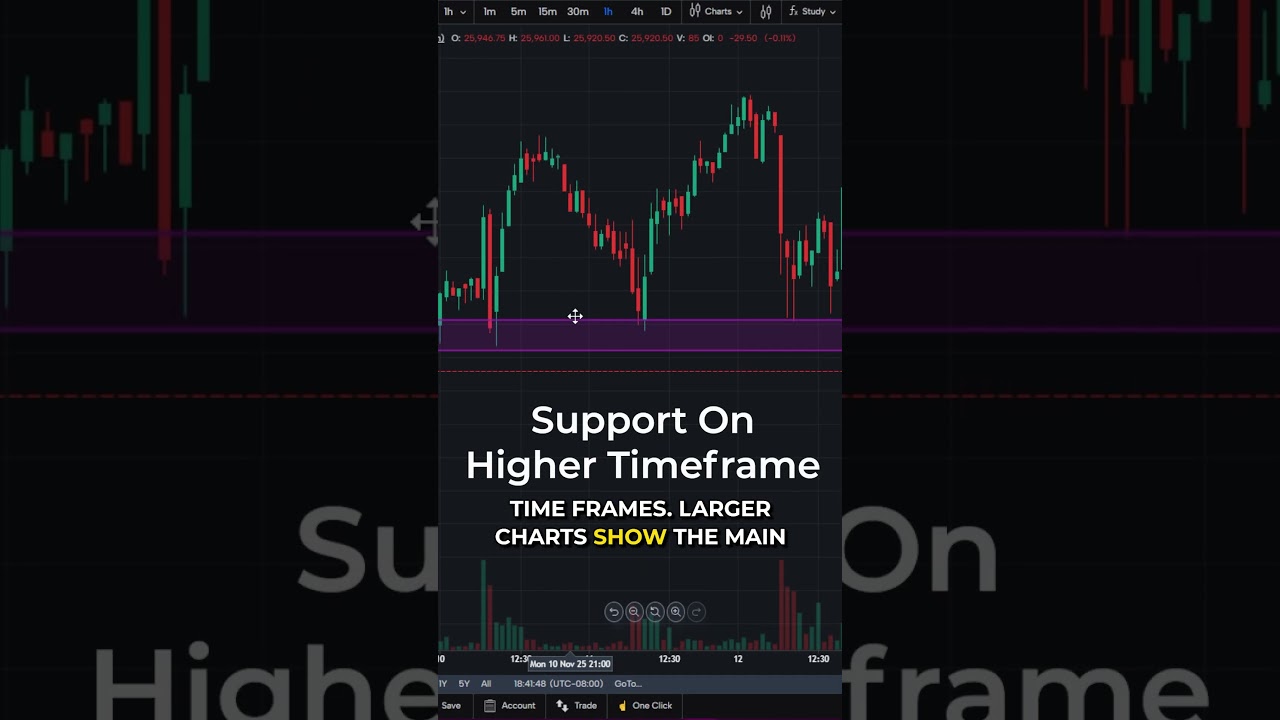
The line graph is ideal for higher time-frame analysis where a trader does not need to see all the details and just wants to get a sense of direction, analyze market flow and overall trend structure. Here, the line graph should be chosen over the candlestick charts because line graphs provide a clear picture without any noise. The screenshot below illustrates this point nicely; trend moves, trend formation, even price patterns and market formations are very clear and jump right at you.

However, in certain situations, when making trading decisions and fine-tuning trade parameters such as stop loss distance and location, the information of the candlestick charts are necessary to accurately estimate the level of volatility and placing trades. Nevertheless, line graphs and candlestick charts can, and should be, used in combination by traders more often. (The placement of contingent orders such as a “stop-loss” or “stop-limit” order, will not necessarily limit your losses to the intended amounts, since market conditions may make it impossible to execute such orders).

Point and Figure Charts
Point and Figure charts are non-time based charts which means that the component of time is completely removed from the charts. Instead, Point and Figure charts focus exclusively on price movements and momentum. If, for example, there is no momentum and price just drifts sideways, a Point and Figure chart might not show any new chart information at all; this feature is similar to Renko charts.
Thus, Point and Figure charts filter out noise very effectively because when markets don’t move, Point and Figure charts will remain the same and not overload the trader with unnecessary information. Furthermore, low momentum and low volatility sideways markets can easily skew the information on price indicators when using conventional candlestick or bar charts. But by using Point and Figure charts, your indicator information will generally be more accurate and precise.

Point and Figure charts are ideal for momentum, trend-following and breakout traders because that is exactly what the Point and Figure charts are designed for. At the same time, since a Point and Figure chart is divided into squares, technical analysis becomes objective and a lot of the subjectivity from candlestick charting is removed. Drawing trendlines or horizontal support/resistance is straightforward because a trader must follow the squares on his charts and it becomes obvious how the charting tools need to be drawn while many traders often struggle with the information overload on candlestick charts. However, gaps are not visible on Point and Figure charts which is a disadvantage many traders talk about.

There is a lot more to picking the right charting method and it goes deeper than most traders realize. Going for a “single best” method is usually not a good approach as it is highly subjective. Thus, we recommend that you familiarize yourself with the different charting methods, take a look at your own trading and see how and when a different charting tool can potentially benefit your trading and price analysis.
There is a substantial risk of loss in futures trading. Past performance is not indicative of future results.