Tsachi Galanos, CEO of Bookmap, talks to Matt Zimberg, CEO of Optimus Futures, to discuss the Bookmap Trading Software.
What is your personal background and how did you end up with developing Bookmap?
Tsachi: I have over eight years of experience in the financial services industry. In the beginning, I dealt with automated trading strategies and trading systems, including HFT. Roughly two years ago VeloxPro, the company I manage, shifted its focus from proprietary trading activity (mainly algorithmic HFT), to developing an Order Book visualization platform. We named our platform Bookmap (stands for order BOOK and heat MAP).
The reasoning behind the development of Bookmap was the need for a more advanced analysis tool for our HFT activity. Sergey, my partner, and I wanted to visualize the orders we sent to the market. When traders that worked with us saw the initial version of the heatmap we developed, their reaction was very positive. Many of them told us it would be great to have such a tool for their trading activity. So eventually we decided to focus on making Bookmap not just an internal tool but a full, robust market depth visualization platform that will be suited for every trader in the market.
The first version of Bookmap was launched at the end of 2014. At that time, it was only at an alpha stage and just a proof of concept. Today, Bookmap is a robust platform, and it is gaining traction and popularity among active Future traders. We receive great feedback from traders on a daily base.
Why is visualization important?
Tsachi: Visualization plays a significant role in understanding what is happening in the market and in making better and more informed trading decisions. Looking at data in a pictorial or graphical format enables users to grasp the entire market data with greater ease and identify patterns that are otherwise difficult to observe.
An excellent article I recently read describes data visualization as wayfinding, “like the street signs that direct you to a highway, and figuratively, where colors, size, or position of abstract elements convey information. In either sense, the visuals, when correctly aligned, can offer a shorter route to help guide decision making and become a tool to communicate information critical in all data analysis. “https://www.wired.com/insights/2014/01/big-data-look-like-visualization-key-humans/
BookMap Demo Right Here With Real Live Data. See How Market Visualization looks Like!
What is the primary value of Bookmap?
Tsachi: Currently, traders are ill-equipped and lack the ability to absorb and conceptualize all the available market data. Also, there is an inherent lack of transparency in current charting tools. They provide a filtered or aggregated perspective of the market and therefore do not allow traders to get real insight into actual supply and demand, leaving them significantly shortsighted as far as market activity is concerned.
Let me be more specific and give you three examples:
- Most traders utilize price and volume data. This accounts for roughly just 5% of the market data or activity in the market. Traders continue to use traditional tools like bar charts to consume market data and make their trading decisions. Bar charts are limited in scope when trying to decipher real-time market data. Bookmap provides a visualization of additional data streams. With our heatmap technology, we provide a visual representation of market depth. Bookmap’s technology provides the missing element to stay fully informed with all the relevant data in one place. The data provided by Bookmap’s heatmap technology gives traders expert-level insight to all market activity and consists of 100% of the market data at a glance.
- Most daily active traders use the DOM. These types of traditional depth view can only provide continuously updated numerical representations of the market. With today’s high pace algo driven market, it is virtually impossible to track all changes and updates to the data.
- Watching tick by tick market changes can be tiresome, time-consuming and prone to errors.
Bookmap was designed and built to solve all these problems. It contains 100% of the market data, and it enables you to track all historical changes and real-time depth updates with ease.
How does Bookmap work?
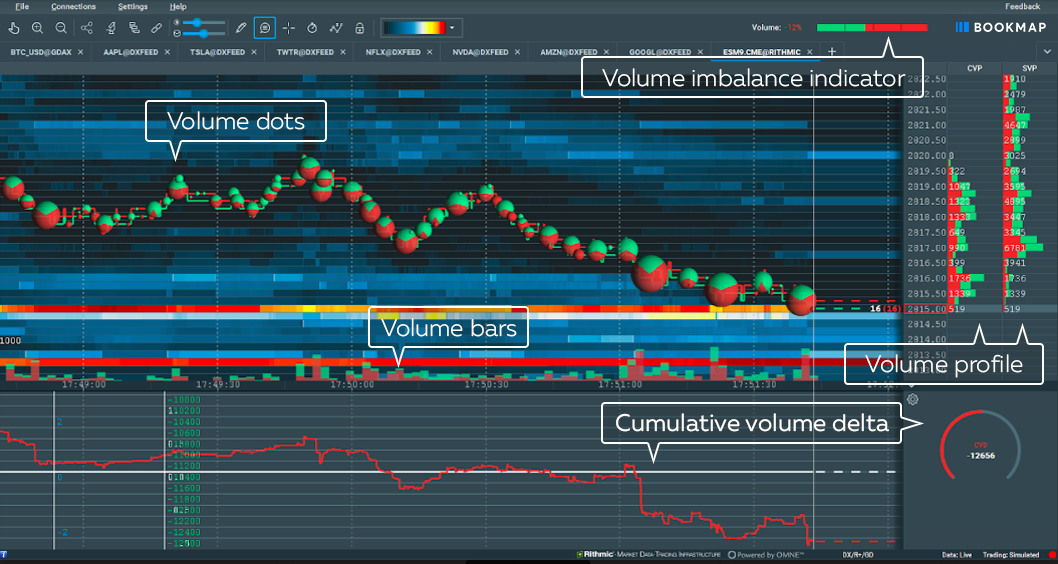
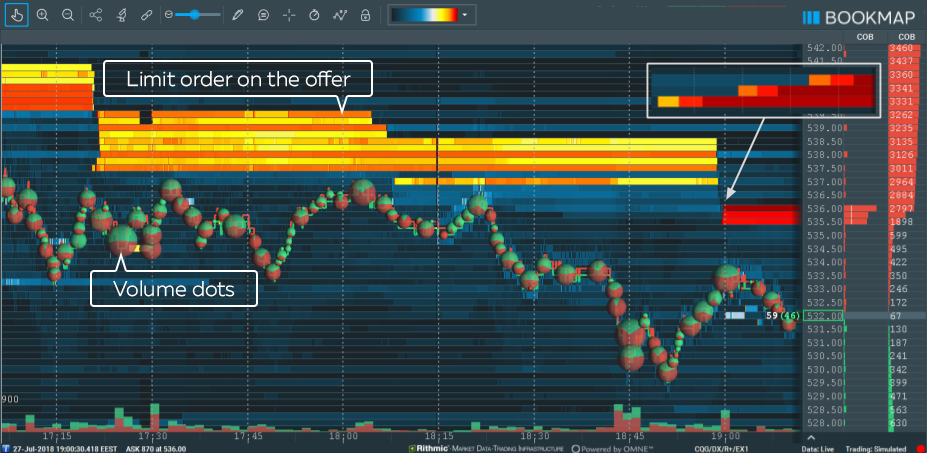
Tsachi: Bookmap visualizes the order book using a heatmap, which is updated very frequently (video like 25-40 FPS). The heat map records and visualizes every change in the order book by displaying it on a scale of gray shades. The brighter shades mark price levels with a larger number of resting paper while darker shades mark areas of lower liquidity. The heatmap gives a clear view of how the entire limit order book and traded volume evolve over time, enabling traders to get faster and deeper insights into market dynamics.
Some traders say that there is no value in watching the depth of market activity. What do you have to say to those ‘voices’?
Tsachi: The depth of market data continues to be disseminated and is still subscribed to by market participants. Trading platforms provide a numerical representation of the data. Bookmap has converted the data into a visual, allowing a better and deeper analysis in both real-time and historical environments. Orders placed in the market can lure liquidity seekers and act as a magnet for price action. Over supply at a particular price can create resistance and excessive demand can create price support. Bookmap clearly displays supply and demand as represented by market participants.
Also, when you see abundant size liquidity in the individual price levels, you can’t gauge with today’s platforms how long is it in the market or how it was changed during the last 10 minutes or how it reacts to price movements. Most traders are focused on the volume that is being traded, which is the past. With Bookmap, you can see not only the volume traded but also the limit orders representing the intentions of market participants. Bookmap is the only tool that allows you to see this behavior, historically and in real-time.
What are the main features of Bookmap that you think would be an advantage over order flow platforms in the current market place?
Tsachi: There are many important features built into Bookmap. Let me mention a few unique ones:
- The heatmap that shows the dynamic in the order book
- The Volume Dots with a unique way to filter the traded volume
- Replay mode that lets you simulate your strategy
- Trading from the chart
- Zooming into the nanosecond of time and viewing market data details, without limitations
Recently, we also launched and developed a custom service for quantitative analysis with API access to the visualization layer.
BookMap Demo Right Here With Real Live Data. See What Market Visualization looks Like!
Do you have In-house traders?
Tsachi: Our team is made up of both former and active traders with up to 15 years of experience in the various markets across different types of trading activity, such as day trading, proprietary trading, hedge fund strategy development and value investment.
What impact will your innovation have on the financial services industry?
Tsachi: Bookmap xRay provides information that was otherwise not practically available for traders before. By providing access to this information, Bookmap xRay increases the transparency in the market and provide traders with an additional way to gain insights and analyze the market.
Who is the target audience for the product/service?
Tsachi: Bookmap is used by all types of traders including active futures traders, proprietary trading firms, active day traders and quantitative analysis teams and soon we’re about to launch a product for equities.
How do you see the future?
Tsachi: I believe that clients will demand more transparency to get wider, more accurate data and more analytics/visualization in real time with the aim of being able to make quicker and better decisions. With Bookmap, we intend to continue to focus and improve these aspects.
Thank you Tsachi for this educating interview. I wish you the best of luck with your Bookmap product.
Tsachi: Thank you, Matt, for the opportunity to share this with your audience and supporting our customers.
Join our Bookmap Q&A
There is a substantial risk of loss in futures trading. Past performance is not indicative of futures results.


