The article on Anchored VWAP is the opinion of Optimus Futures, LLC.
- The Anchored VWAP provides a more contextual and accurate representation of price movements by “anchoring” the price data.
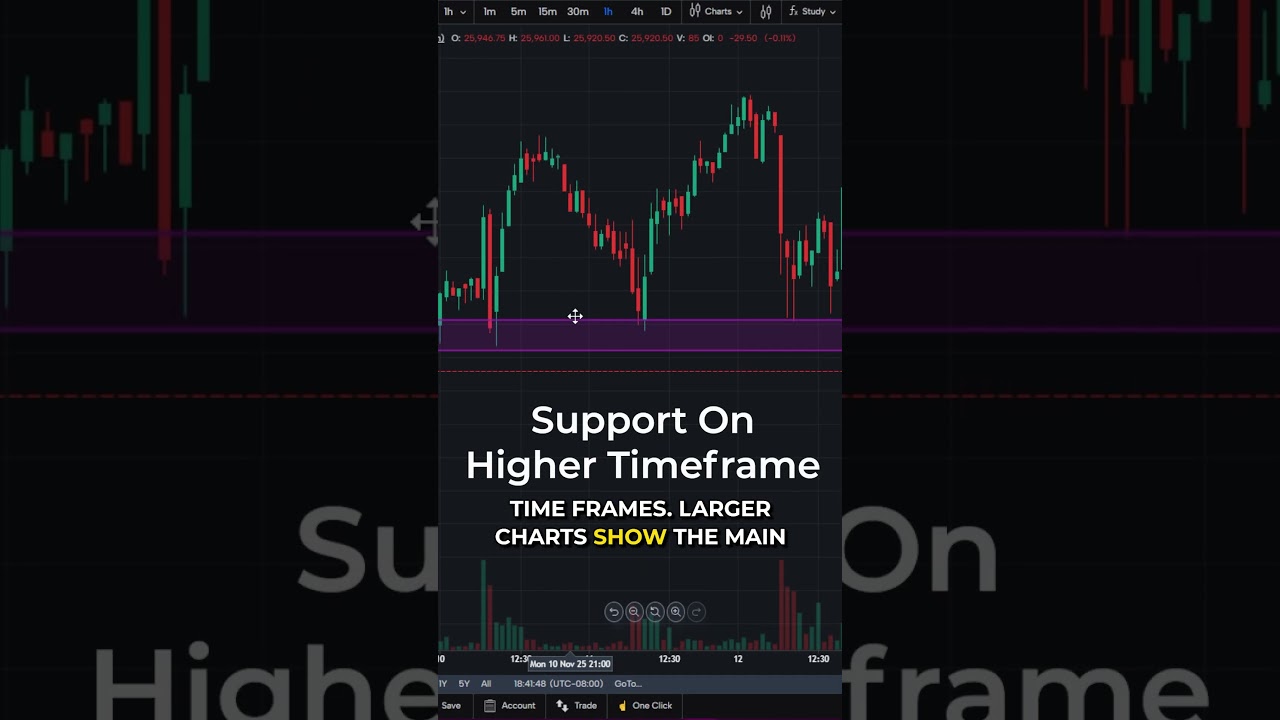
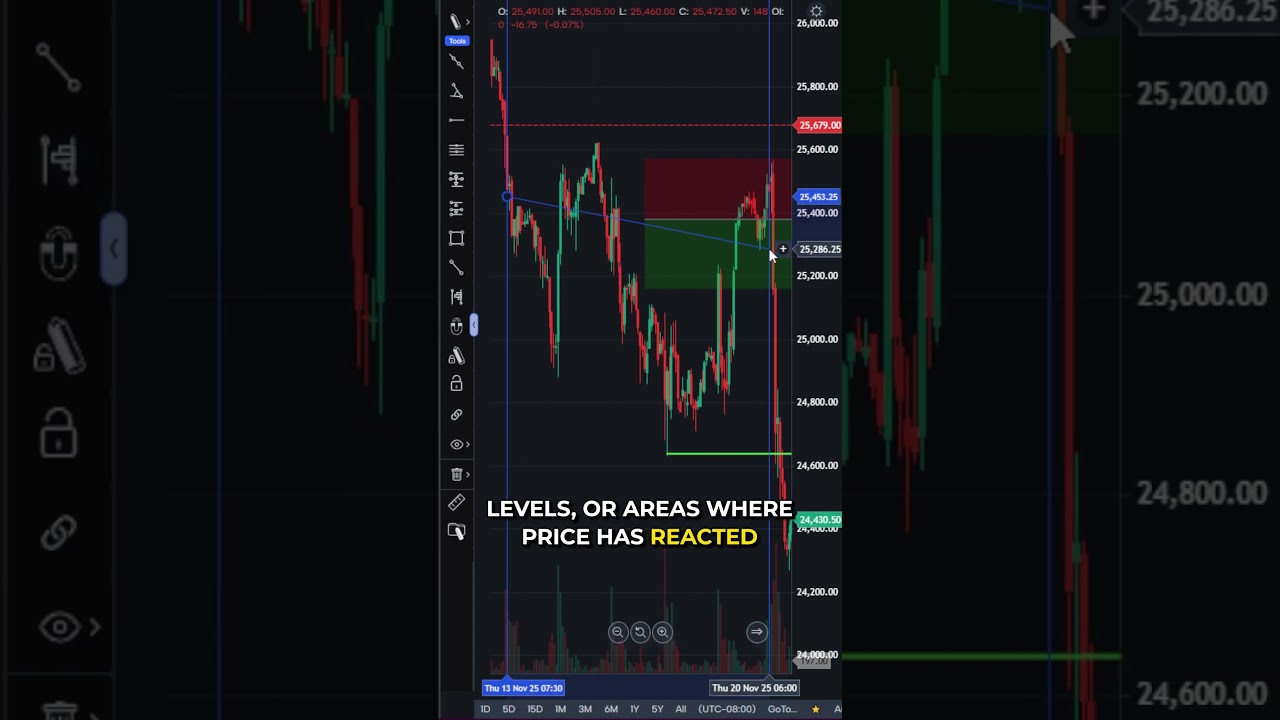
- It’s useful for identifying support and resistance, assessing trend direction and strength, and analyzing market reactions to significant events.
- Common mistakes when using Anchored VWAP include over-reliance on it as a support/resistance level, failing to re-anchor, not considering volatility near the anchor point, and ignoring the broader market context.
Many day traders heavily depend on the Volume Weighted Average Price (VWAP) to guide their trades. The VWAP is a useful indicator that shows market sentiment and can act as an important reference point for trading.
What is the Anchored VWAP?
The Anchored VWAP (Volume Weighted Average Price) is an indicator that calculates the average price of an asset, weighted by volume, from a specific starting point or “anchor,” such as a significant high, low, or event date.
The “anchor” aspect is important, as it can offer a more contextual and accurate representation of price movements compared to traditional VWAP, which resets daily. For example, a trader might set the anchor point at a significant high or low, an earnings announcement, a gap, or any market-moving event that a trader may deem important.
The Anchored VWAP can be useful for identifying support and resistance, assessing the direction and strength of a trend, and analyzing the market’s reaction to specific events.
From setting customizable timeframes to gaining deeper, fine-tuned market insights, you’ll learn how this advanced tool can significantly improve your trading approach.
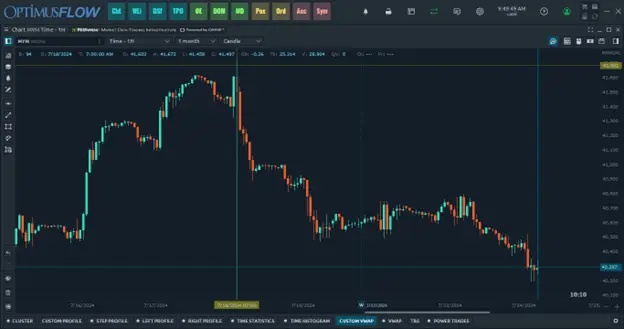
Activating Anchored VWAP on Optimus Flow
To enable the Anchored VWAP on Optimus Flow, follow these simple steps:
1 – Right-click on the chart.
2 – Go to “Volume Analysis” and click “Show Toolbar.”

3 – Select “Custom VWAP.” in the toolbar below (see highlighted image)

4 – Two blue lines will appear, indicating the date range to anchor from. Choose your desired start point and click to set the anchor.
Note that a major high was selected. Once you click it, the result is as follows:

Learn how to use Anchored VWAP on TradingView | TradingView Anchored VWAP Indicator: Guide for Traders
Tips for Using the Anchored VWAP
1 – Select an Anchor Point
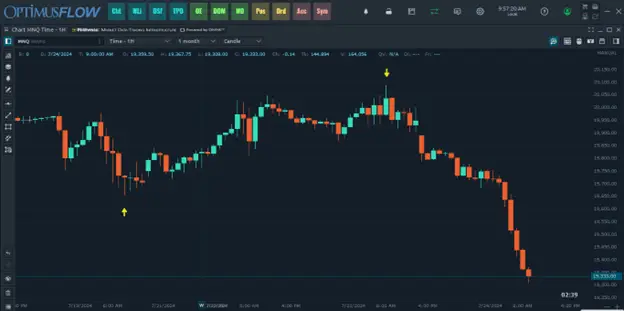
Choosing the right anchor point is crucial. Significant swing lows or highs are typically the best points to anchor from. For example, in the image below, the swing low and swing high (see yellow arrows) could have served as effective anchor points.
2 – Analyze Price Reactions
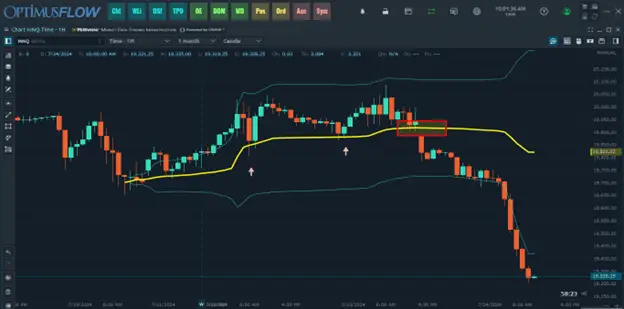
Observe how the price interacts with the Anchored VWAP. If the price consistently respects the Anchored VWAP, it indicates a strong relevance. Conversely, frequent invalidations suggest that the chosen anchor point might not be significant.
In the case below, the Anchored VWAP held (see pink arrows) up until the red rectangle. What happened? There was a major fundamental shift in the markets in which overvalued tech stocks were slowly going out of rotation (pay attention to fundamentals too, or else, you won’t be able to understand major shifts in the market).
3 – Using Multiple Anchored VWAPs
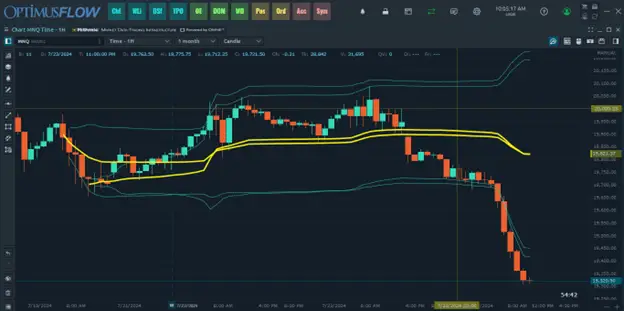
Anchoring from both swing lows and highs can provide deeper insights. This dual approach, known as the VWAP pinch, involves the price moving between the anchored points from both extremes, resembling the behavior seen with Bollinger Bands.
In this example, an anchor at the swing preceding the swing low was added, creating a band around the price action.
4 – Practical Application
The Anchored VWAP can be applied from various significant market events beyond just swing highs and lows. For instance, anchoring from the start of the year, major earnings announcements, or gap events can provide valuable insights into market behavior post these events.
Common Mistakes and Their Solutions in Using Anchored VWAP
1. Assuming it Will Always Work as Support and Resistance
- Mistake: Traders often assume that because Anchored VWAP has worked well as a support or resistance level in the past, it will continue to do so indefinitely. This overconfidence can lead to doubling down on positions and incurring significant losses when the market behavior changes.
- Solution: Understand that market conditions are always changing. Use Anchored VWAP as a tool among others and avoid relying on it exclusively. Regularly review and adjust your strategy based on current market conditions and other indicators.
2. Forgetting to Re-anchor VWAP
- Mistake: Traders sometimes forget to re-anchor their VWAP on a new month, week, or specific timeframes they are monitoring, such as a rolling 3-week period.
- Solution: Make it a habit to update your Anchored VWAP regularly according to your trading timeframe. Utilize custom-developed user indicators in TradingView that can automatically adjust for rolling periods, ensuring your VWAP is always relevant and up-to-date.
3. Not Realizing the Volatility Near the Anchor Point
- Mistake: Traders might not recognize that the closer they are to the anchor point, the more volatile and less reliable the VWAP will be. This can lead to misjudging the strength of support and resistance levels.
- Solution: Be mindful of the time since the anchor point. For traditional VWAP, it’s more reliable after the opening rush. For Anchored VWAP extending over multiple days, ensure there’s sufficient volume and data to establish a reliable reference point. Use common sense and avoid making trading decisions based solely on VWAP when near the anchor point.
4. Ignoring Market Context
- Mistake: Focusing solely on Anchored VWAP without considering the broader market context, such as overall trends, news, and other technical indicators.
- Solution: Integrate Anchored VWAP with other technical and fundamental analyses. Always consider the broader market context and how various factors may impact the effectiveness of VWAP as a support or resistance level.
Catching these common mistakes can help you use the Anchored VWAP more effectively while avoiding unnecessary losses.
The Bottom Line
The Anchored VWAP can be a powerful tool for traders, providing precise market insights by allowing custom anchor points. But be cautious—common mistakes like the four mentioned above can lead to poor trading performance; so, be mindful of the context and how you’re using the indicator.
Combining it with other indicators and regularly updating your anchor points can help you harness the full spectrum of the Anchored VWAP’s potential. Like every technical indicator, it takes experience and tweaking to get the most out of this tool in a way that works for your trading style. So, good luck and happy trading!
Trading Futures and Options involves substantial risk of loss and is not suitable for all investors. Past performance is not necessarily indicative of future results.