Market turning points always stand out nicely on price charts which makes them so easy to see and it creates the illusion that those types of trades are easy to catch. However, trying to catch tops and bottoms is usually what causes the average amateur trader to enter large losses. In this article, we will explain how the average trader views market turning points and introduce an alternative way of trading during such scenarios.
What is a market turning point?
Market turning points usually stand out on every chart and when we talk about market turning points, we mean those obvious tops and bottoms where markets go from bullish to bearish or vice versa. Elsewhere, you might find the term V-top/ V-bottom, or double top/double bottom, and those all essentially describe the same pattern.
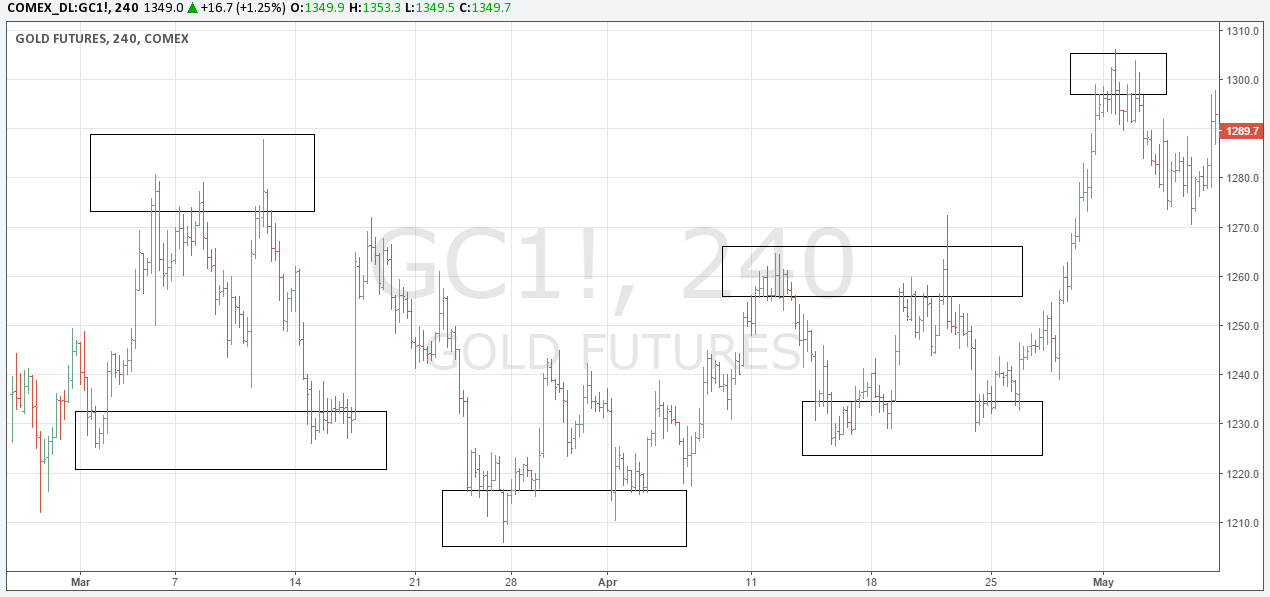
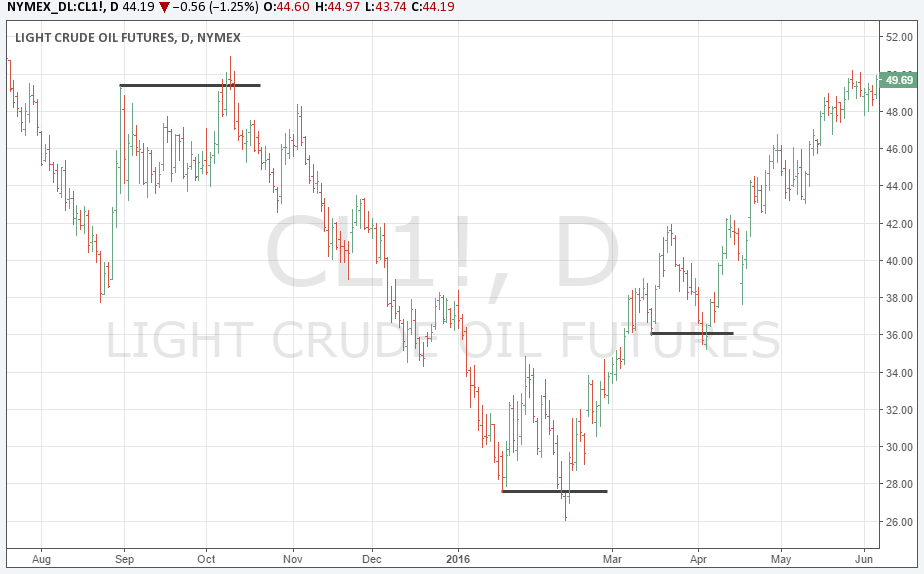
Basically, we look for a place and price level where price went from going upwards to selling off; thus, a market turning point is a reversal price area. In the screenshot below, we marked different types of turning points.
Common trading mistakes at turning points
Although trading market turning points seems to be a very easy trading strategy because such reversal levels always stand out clearly after the fact, the trading behavior and the way people trade those price levels is usually not optimal. At the same time, it’s very easy for professional traders to guess how the average amateur trader executes his trades around a market turning point and then use this knowledge to his advantage.
Whenever you read a trading book or visit an educational trading website, the general recommendation is usually to place the stop loss just outside of the turning point and then move the stop loss to the point of break-even when price moves in your favor.
If you listen to other traders, you can see that this is indeed a very common approach and when many traders follow the same advice, it can create huge order clusters around those levels that then attract the attention of professionals because they can use those clusters to trade against and squeeze those amateurs. This is of course our opinion, and the reflection of our experience, and even professional are not guaranteed to gain any capital.
The placement of contingent orders by you or broker, or trading advisor, such as a “stop-loss” or “stop-limit” order, will not necessarily limit your losses to the intended amounts, since market conditions may make it impossible to execute such orders
Squeezing amateurs at market tops
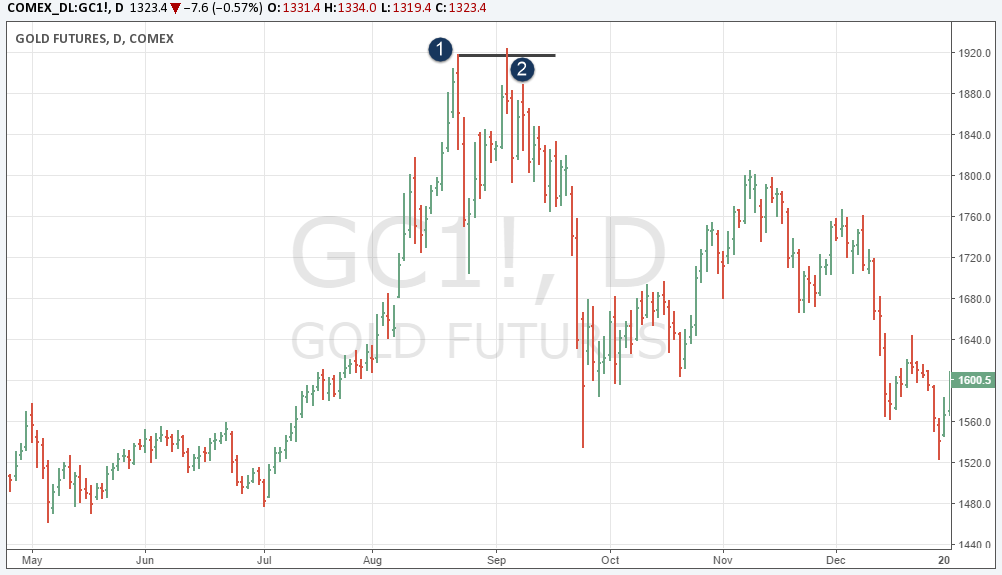
The screenshot below shows a classic market top. After a long rally, price started to move lower and many traders sold into a new, potential downtrend (1). As price kept moving into their favor, they moved their stops at the top to ‘protect their position’. What then happened is textbook: price reversed, shot back up and took out the previous high just by a small bit before it sold off again (2). You can see that even after point 2, price came back and tried to make another run at the high.
Let’s dissect what happened here from an order-flow perspective:
- Traders enter a short position around the first market top
- They move their stops to the first high (a stop on a sell trade is a buy order)
- Professionals drive price back into the highs to trigger the stops
- The squeezed traders buy (stop loss) from the professionals who enter short at point 2
- The stop cluster causes a huge order trigger and then drives price lower
Trading tips for turning points
There is a better way to trade those types of situations and a few tips that can help you avoid the most common problems:
- Stay away from trading initial market turning points.
- Instead, wait for the second pullback into such a level and then see if you can spot the squeeze or fake breakout pattern.
- But only enter AFTER price reverses back into the original direction. Stay away from picking tops/bottoms during such a squeeze.
The screenshot below shows normal market behavior and you can see that those squeezes around those obvious tops/bottoms are a common behavior. You can pull up any chart and you’ll be able to find this type of squeezed double bottom/top very often because it’s a way to drive massive trades for professional traders with the help of wrong positioned amateur traders.
Always keep in mind that when you are looking at a key price level that stands out and is very obvious to see, many amateur traders will use such a level for their own order placement. It is then very easy for the professional to take out those amateurs. Thus, you should try to think more like a professional and avoid following the herd trading tips that lead everyone to do the same, costly mistakes.
There is a substantial risk of loss in futures trading. Past performance is not indicative of future results.