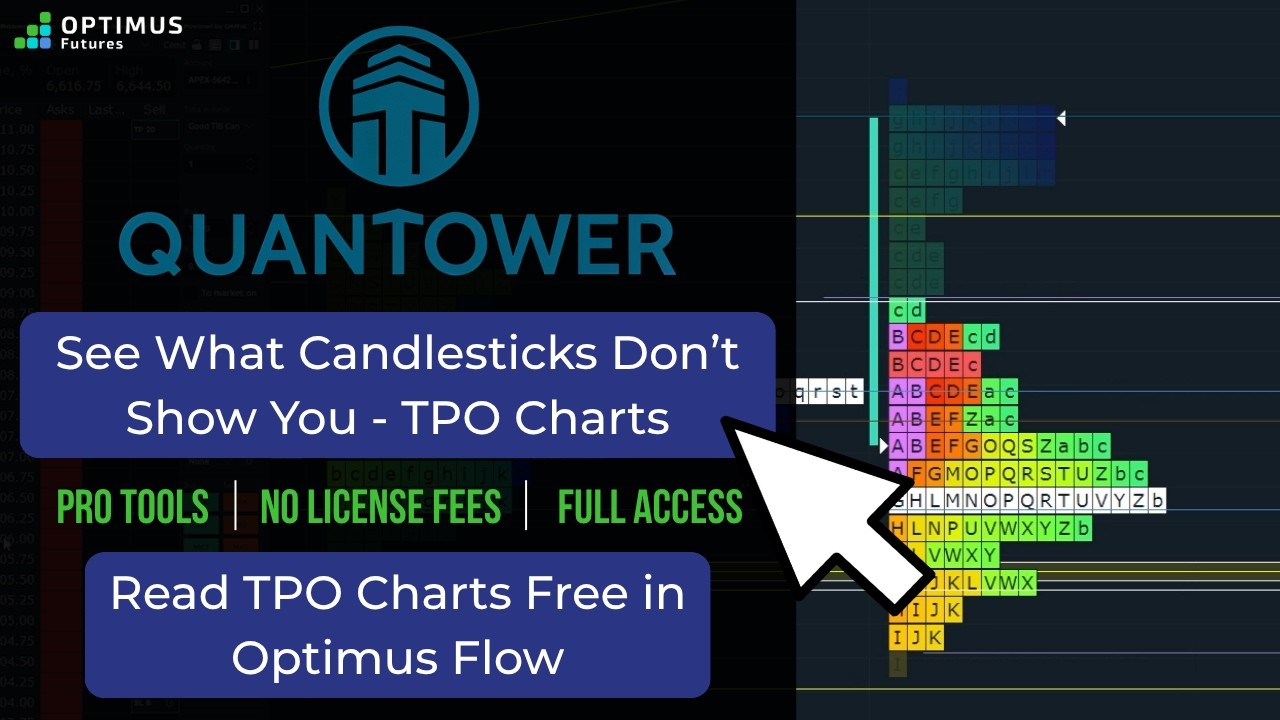
Learn how to apply and adjust Bollinger Bands in TradingView Mobile better to visualize volatility and dynamic support/resistance levels.
You’ll see how to:
✅ Tap the slider icon to open the indicator menu
✅ Search for “Bollinger Bands” and add them to your chart
✅ Tap the gear icon to customize length, deviation, and colors
✅ Tap the trash icon to remove the indicator if needed
A flexible way to tailor your volatility tools for mobile charting.
👉 Subscribe for more bite-sized trading insights and platform tips. Looking for a Futures Broker? http://www.optimusfutures.com
There is a substantial risk of loss in futures trading. Past performance is not indicative of future results. When considering technical analysis, please remember educational charts are presented with the benefit of hindsight. Market conditions are always evolving, and technical trading theories and approaches may not always work as intended. The placement of contingent orders by you or broker, or trading advisor, such as a “stop-loss” or “stop-limit” order, will not necessarily limit your losses to the intended amounts, since market conditions may make it impossible to execute such orders. The high degree of leverage that is often obtainable in commodity interest trading can work against you as well as for you. The use of leverage can lead to large losses as well as gains. Optimus Futures, LLC is not affiliated with nor does it endorse any trading system, methodologies, newsletter or other similar service. We urge you to conduct your own due diligence.